31% vs 14%self-report diabetes
diet-only vs neither
01
If you only read one block
Whole story in this box. Everything below is receipts and method.
Big picture
Diet-soda drinkers are not a random sample. They are older, heavier, and about twice as diabetic. That fact writes most of the scary charts you see online.
+0.30 → +0.05blood sugar (HbA1c)
after I drop known diabetes
after I drop known diabetes
+2.5BMI still higher after controls
still +2.3 without known diabetes
still +2.3 without known diabetes
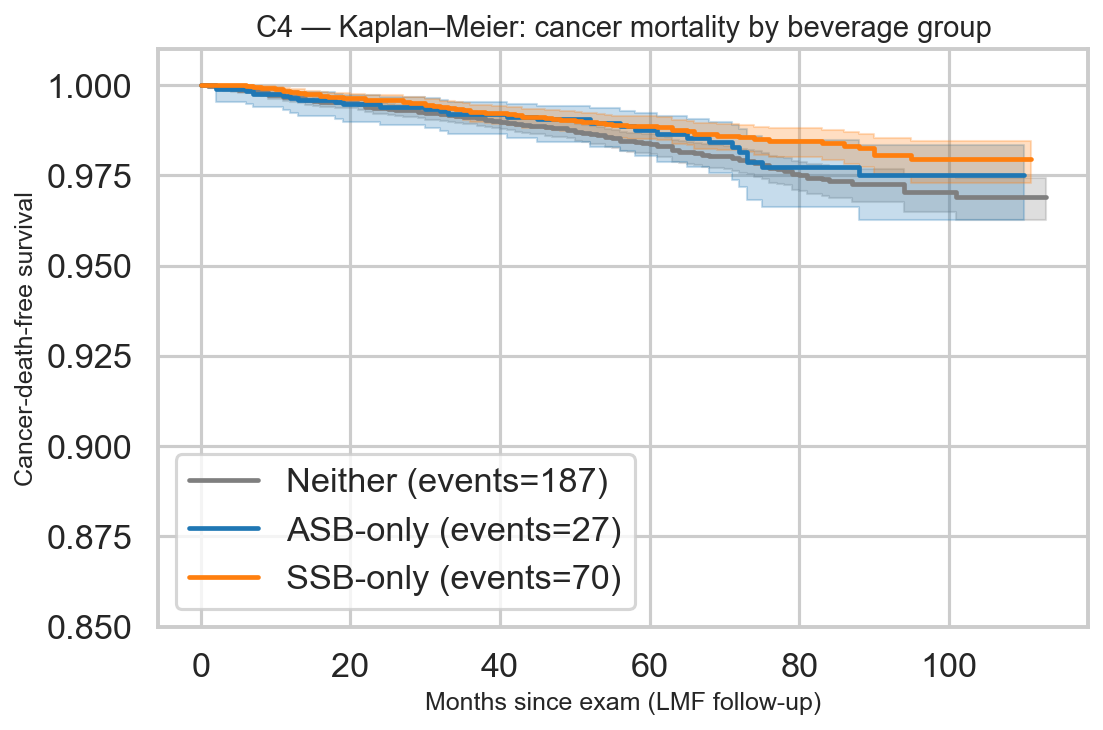
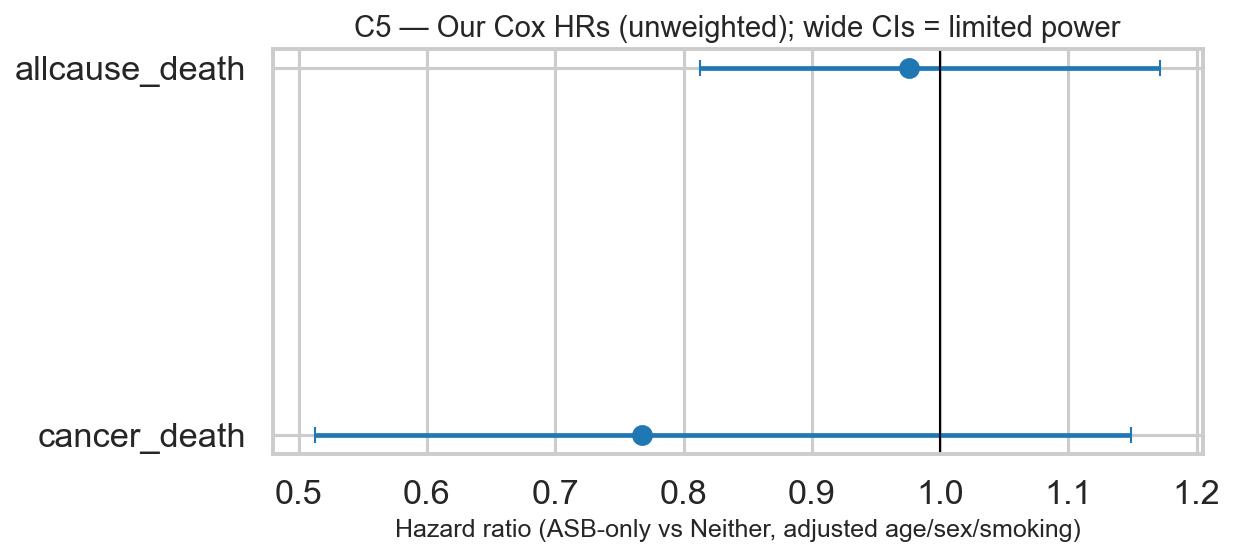
0.77cancer-death rate ratio (HR)
CI 0.51-1.15 · ~27 deaths
CI 0.51-1.15 · ~27 deaths
The feed
“WHO says diet soda causes cancer. Higher cancer rates prove it. It wrecks blood sugar and makes you fat.”
What I found
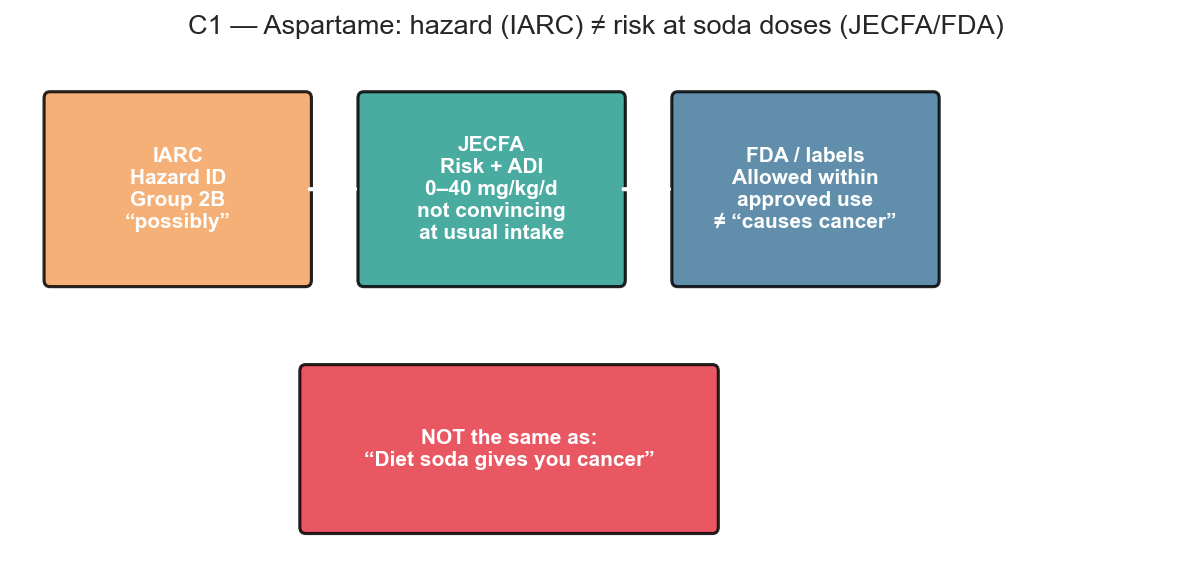
IARC 2B is limited-evidence hazard talk, not a ban and not JECFA risk at usual intake.
People who already look sick on paper drink more diet soda.
Cancer death is not significant, and the diet-soda arm only has about 27 cancer deaths. Weak test. Not a safety stamp.
What I learned
- Who drinks it is half the analysis. Skip that and every crude bar chart lies to you.
- Blood sugar scare is mostly reverse traffic. Known diabetes people switch. Remove them and HbA1c mostly calms down.
- Weight association is stubborn. About +2.5 BMI units after controls. Still not proof the can caused the pounds.
- Cancer slogan is wrong. Tiny long risks stay untestable here. Public survey plus short mortality follow-up cannot clear lifelong site-specific cancer.
Why I bothered with models
A raw bar chart only says “diet-soda people look different.” Models ask a harder question: after I line people up on age, sex, race/ethnicity, education, income, smoking, and calories, does the gap still sit there? Then I stress-test blood sugar by dropping people who already know they have diabetes (people who often switch drinks after diagnosis). That is not a court verdict of “proved.” It is a filter on lazy causal talk. Scoreboard: what held.
Quick words: diet-only = drank diet soft drinks, not regular, on the survey day. Neither = no diet and no regular soft drinks that day. HbA1c = blood-sugar control marker. HR = hazard ratio (cancer death rate comparison).
Sample I used: 19,384 non-pregnant adults age 20+, reliable Day-1 diet. WWEIA 7102 diet soft drinks vs 7202 regular. Groups: diet-only 1,744, regular-only 5,934, both 148, neither 11,558.
Stats honesty up front: I used multi-cycle MEC weights (normalized). I did not run full NCHS PSU and strata variance. Point estimates are the useful part. Tiny p-values are too flattering. One day of diet recall is not a life history. Not medical advice.
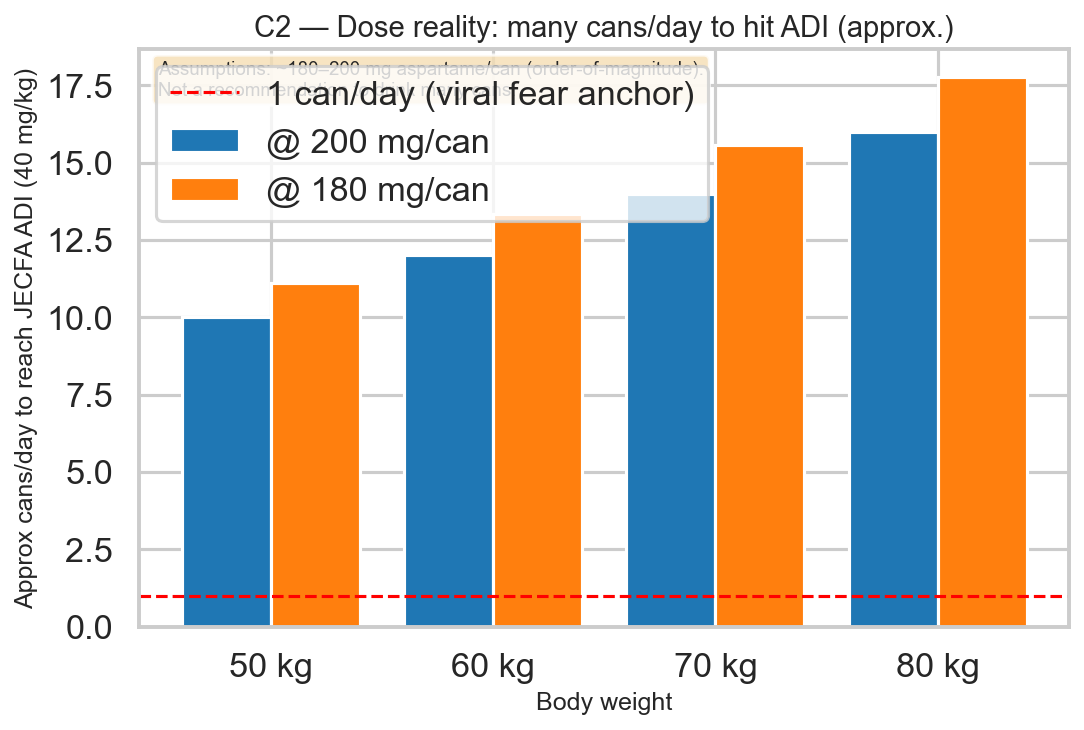
Policy-ish bottom line: do not treat meme posts as risk assessment. IARC 2B is not a soda ban. JECFA still frames an ADI many cans per day order of magnitude at labeled use. Swapping sugar soda for diet soda is a different question than “zero risk forever.” Water still wins the boring contest.
02
In normal words
If higher cancer % and higher BMI in diet-soda drinkers feel like case closed, read this first.
Picture this
Someone gets diabetes or starts worrying about weight. They switch to diet soda. NHANES photographs that day. The chart then says “diet soda people have worse labs.” That can be the switch, not the chemical. I stress-tested that idea. For HbA1c it mostly holds. For BMI the gap stays. For cancer death I simply do not have enough events to act tough.
Meme number
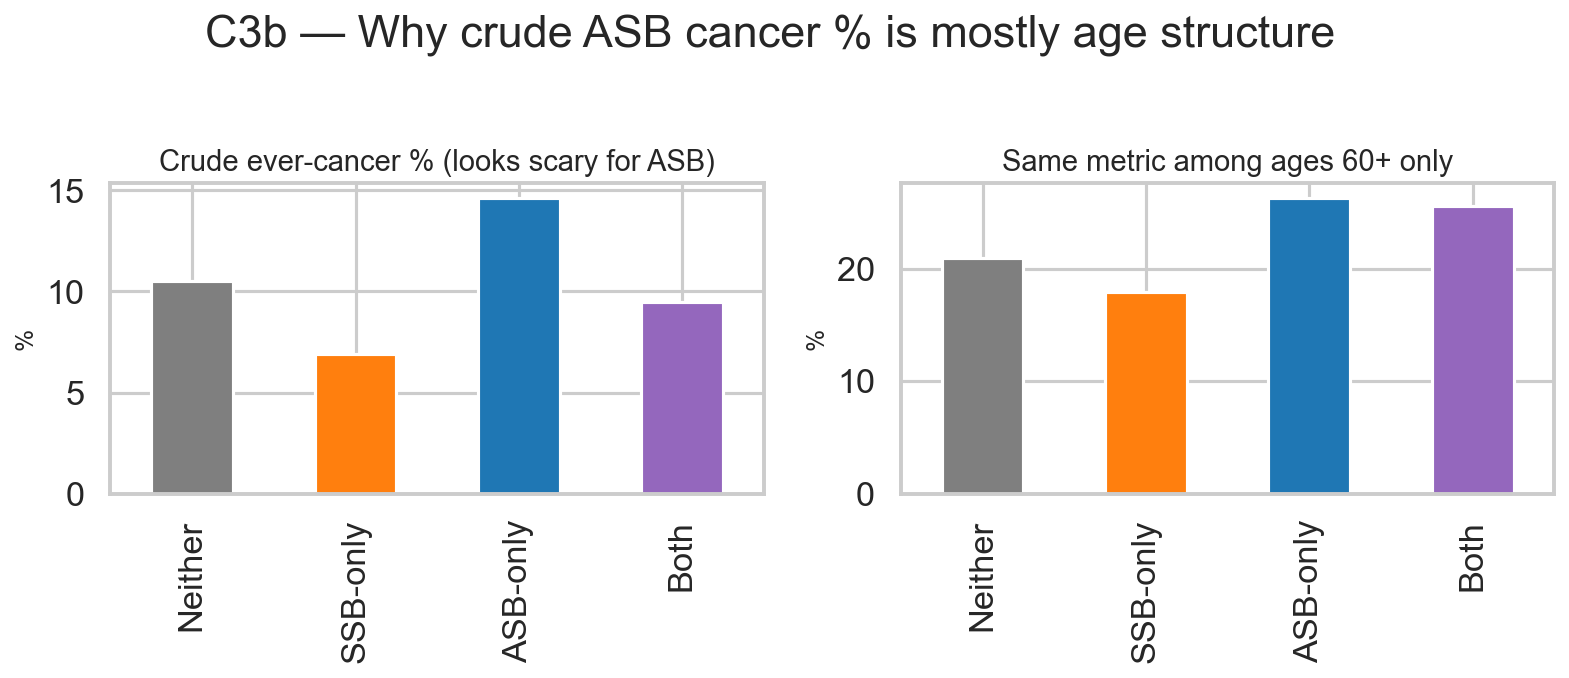
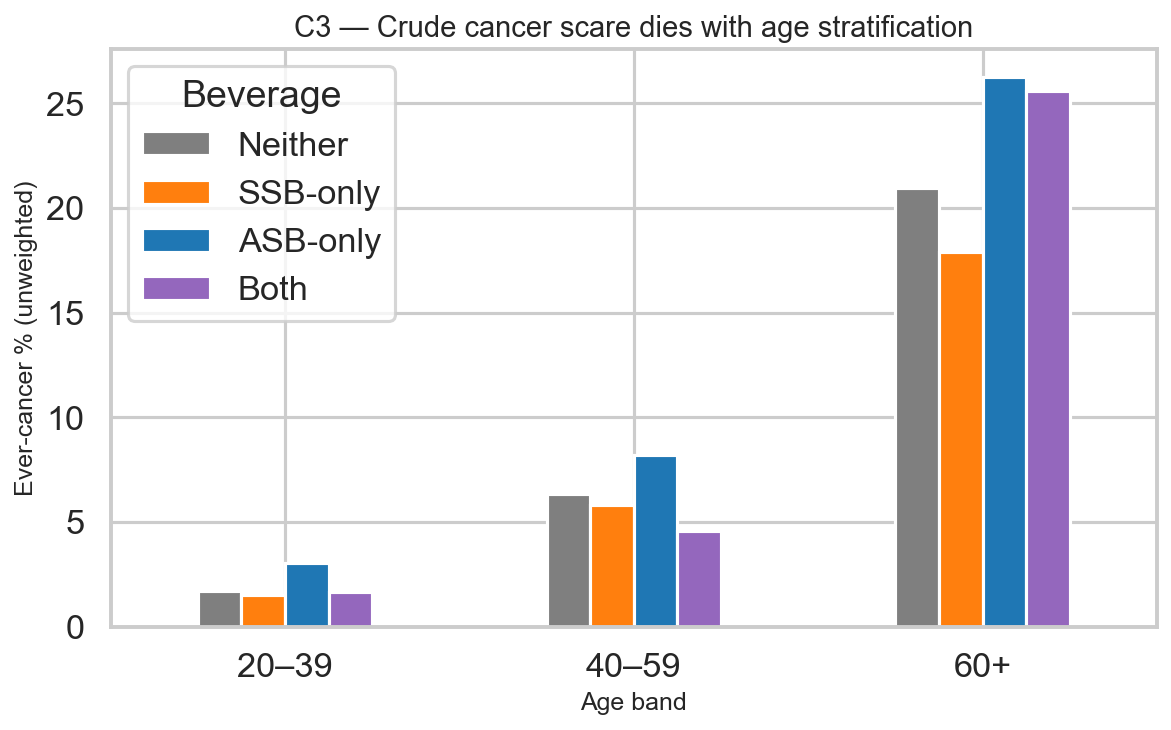
~15%Crude ever-cancer in diet-only vs about 11% in neither. Real gap. Bad causal read without age and who switched.
Number people skip
~27Cancer deaths in the diet-soda arm. That is why HR 0.77 with a CI from 0.51 to 1.15 is a weak test, not proof of safety.
The mechanism
~2×Diabetes rate roughly doubles in diet-only vs neither. Same cast of characters as higher BMI and slightly older age.
Two different questions
Crude % by drink group: who is already in the diet-soda column?
Models with age, lifestyle, and “drop known diabetes”: does the gap still look like a causal punch?
Same survey. Different question. The feed swaps them on purpose or by accident.
Hazard is not risk
IARC Group 2B asks whether something might cause cancer under some conditions when evidence is limited.
JECFA ADI asks what daily intake looks acceptable after risk assessment.
For aspartame that is many cans per day order of magnitude at common can doses, not “one can equals cancer.”
If your feed said WHO banned diet soda, your feed lied by compression.
03
Myth board
Stuff people actually post. My call after running the numbers.
Cancer / WHO / one can
Slogan fails hazard vs risk, dose chart, and a mortality model short on diet-soda events.
BUSTED (slogan)Diabetes / blood sugar
Crude HbA1c about +0.30. After I drop known diabetes, about +0.05. Mostly selection. Not zero. Not proven cause.
NUANCEDMakes you fat
BMI stays about +2.5 after lifestyle controls. Association that will not die. Still not a trial of causation.
NUANCEDSame people as regular soda
No. More diabetes, higher BMI, higher income, older. Love plot and ML both say selection.
BUSTEDDestroys microbiome
Real question for feeding studies. NHANES has no stool data. I name it so I do not fake a null.
UNTESTABLE HEREOnly one model works
I show the BMI spec curve and cycle stability. Multiverse is still my design. At least you can see it.
PROCESS| They say | I say | Jump |
|---|---|---|
| WHO banned diet soda / causes cancer | 2B is not a ban. Mortality test is weak on events. | Cancer |
| Causes diabetes | Blood-sugar gap mostly shrinks after known diabetes out | Diet |
| Makes you fat | ~+2.5 BMI association. Cause not shown. | Diet |
| Destroys microbiome | Cannot test here | Limits |
| Mouse / one can poison | Dose translation + ADI cans chart | Cancer |
| Industry covered it up | Public files. Open code. No industry check. | Build |
04
Cancer
Loudest claim on the internet. Four layers. Agencies, dose, crude %, deaths over follow-up time.
What I care about
Hazard label is not risk at soda doses. Crude ever-cancer % is polluted by who drinks diet soda. Follow-up cancer death is the harder public test, and the diet-soda arm is thin on events.
Hazard is not risk
Dose (ADI to cans per day)
Crude ever-cancer looks scary
Unweighted crude ever-cancer: diet-only about 14.6% vs neither about 10.5%. Age bands shrink the scare. They do not wipe every residual gap (still higher in 60+ in my tables). Design cannot prove cause. Lifetime cancer history next to yesterday’s diet is a bad match.
Cancer death with follow-up months
Cox model (unweighted primary, months since exam, diet-only vs neither, age/sex/smoking): cancer-death HR about 0.77 (95% CI 0.51-1.15), p about 0.20. Total cancer deaths: 285. In the diet-only group: about 27. Not significant. Wide interval. I will not sell that as safety. Rough power notes that assume balanced exposure are optimistic anyway. Diet-only is about 9% of the sample.
I am not claiming
I did not prove aspartame is safe forever. I did not rule out small long-latency site-specific risks (liver incidence and friends). I did not re-run NutriNet. I busted a slogan and showed what this public design can carry.
05
Blood sugar and weight
Everyday claims. Same selection story. Different leftover gaps.
Diabetes scare mostly shrinks
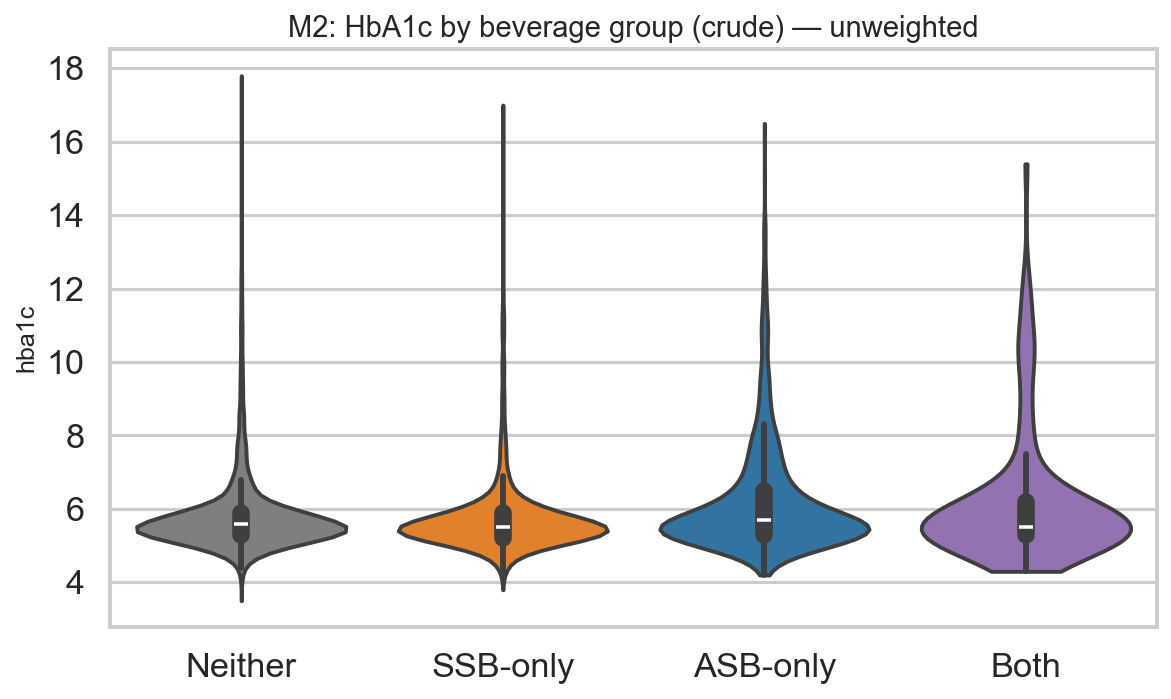
Crude diet-only HbA1c association about +0.30 points. After I exclude known diabetes, about +0.05. That is mostly people who already had the diagnosis walking into the diet-soda group. Residual is small. Still not zero. Still not a trial that proves cause.
- Adjusted (S3): β = 0.30 (approx. 95% CI 0.26 to 0.35; n=17,000)
- No known diabetes (S5): β = 0.05 (approx. 95% CI 0.02 to 0.07; n=14,598)
Weight association sticks
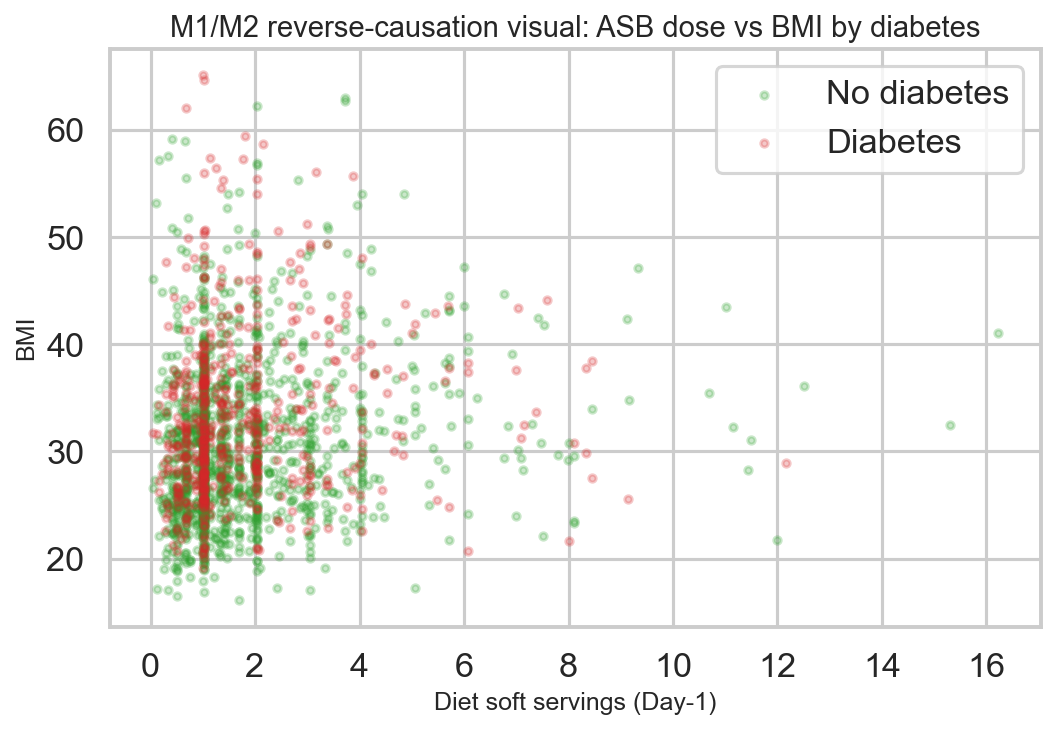
BMI for diet-only vs neither stays about +2.5 kg/m² after lifestyle covariates, and about +2.3 after I drop known diabetes. Real cross-sectional association. Not proven causation. Adding diet-soda features barely helps predict BMI (ΔR² about 0.007).
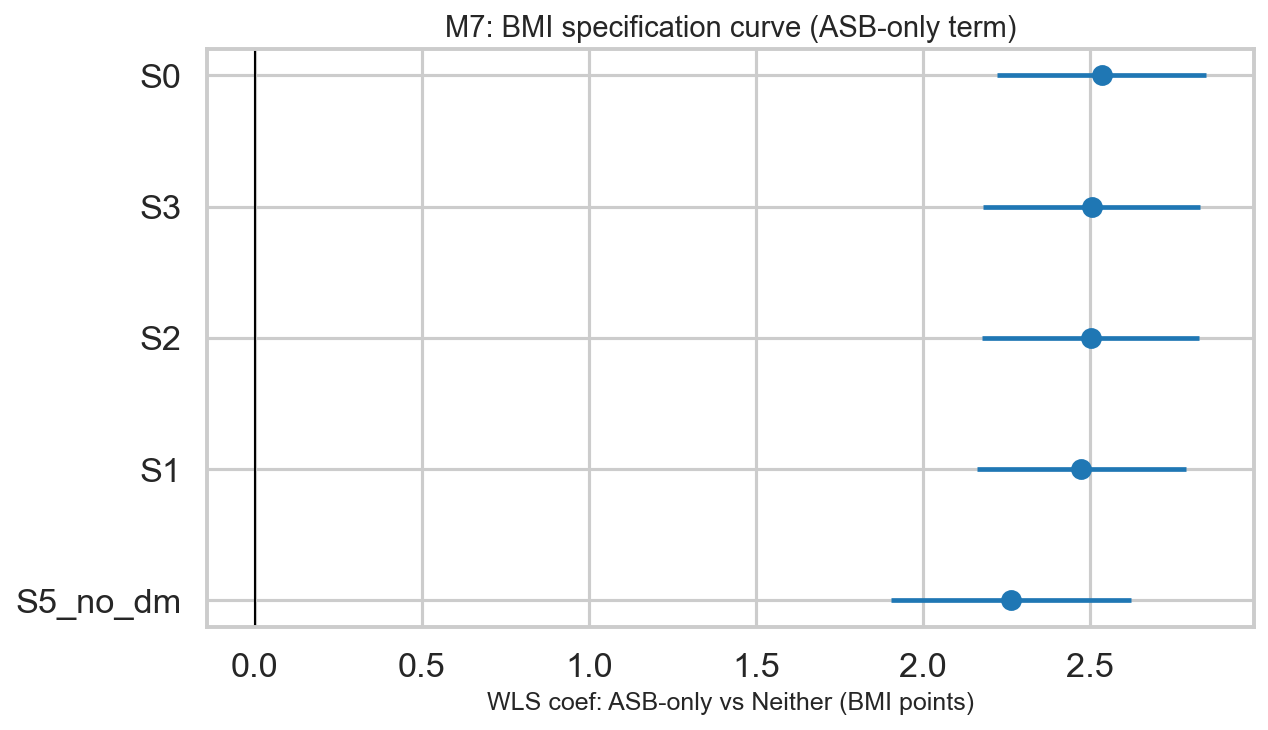
- Adjusted (S3): β = 2.50 (approx. 95% CI 2.18 to 2.83; n=17,446)
- No known diabetes (S5): β = 2.26 (approx. 95% CI 1.90 to 2.62; n=15,018)
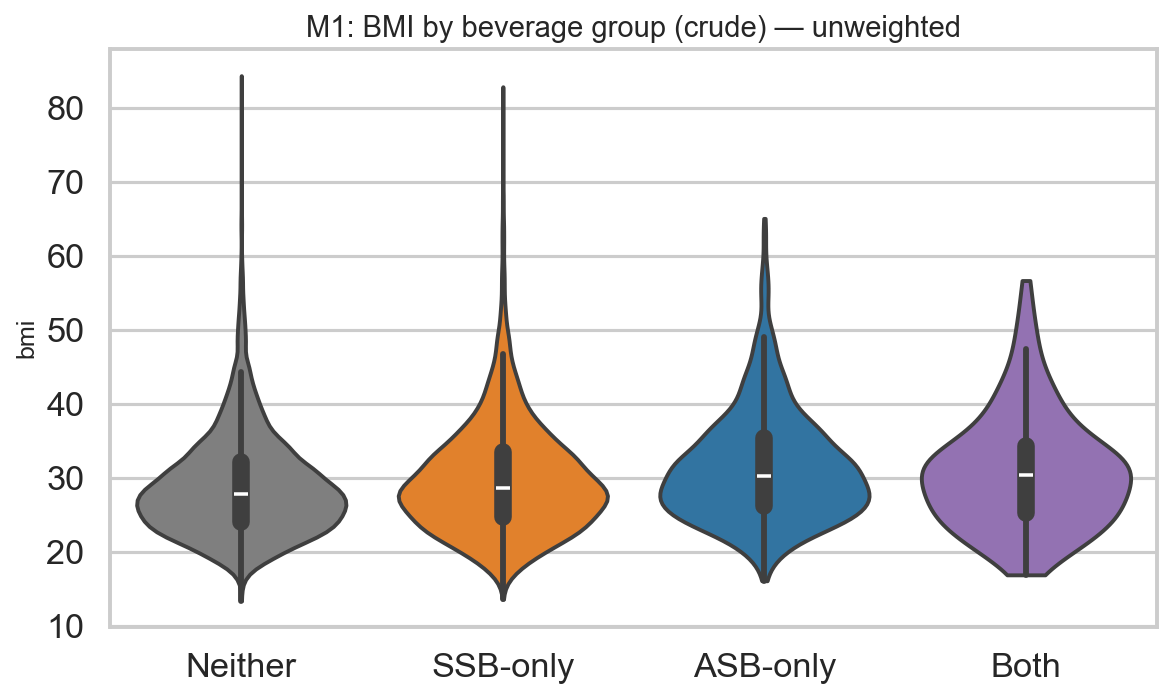
Why sugar calms and BMI does not
Known diabetes is a hard switch into diet soda. Pull those people out and HbA1c mostly falls. Weight is messier. Goals, history, unmeasured lifestyle. Association without a substitution trial is not “diet soda causes obesity.”
06
Who drinks diet soda
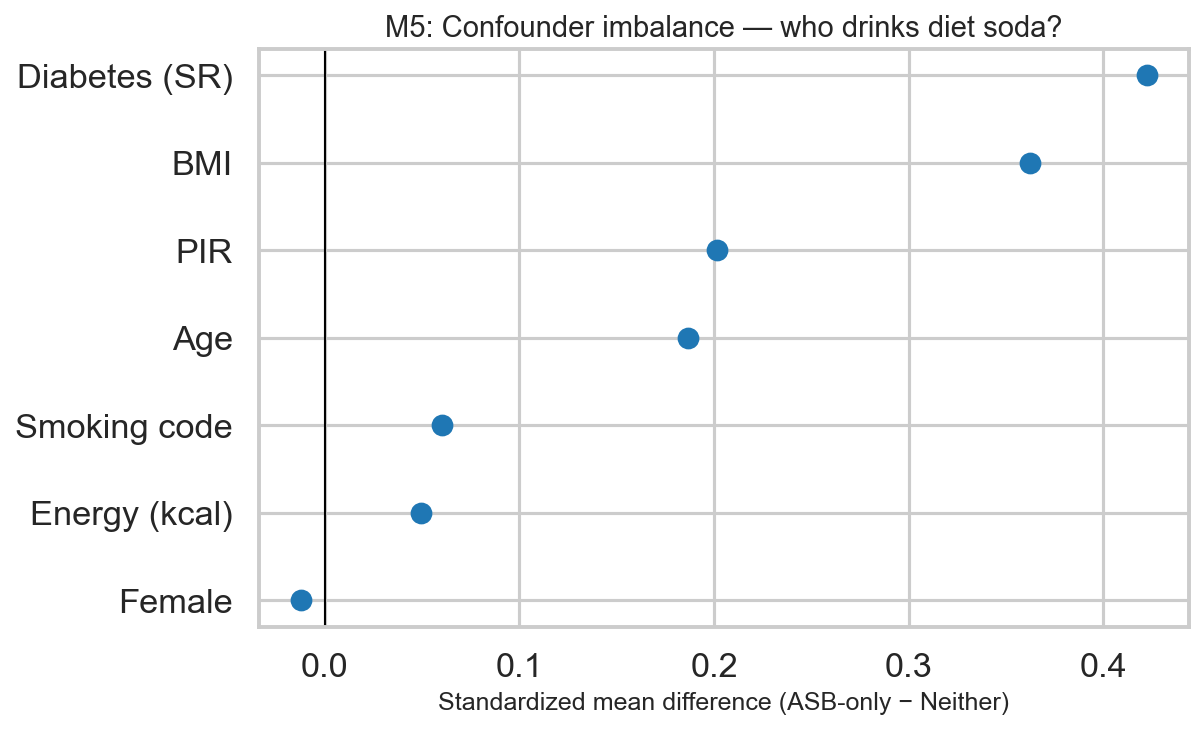
This is the mechanism. Skip it and the crude charts look like proof of cause.
Diabetes (self-report)
31% vs 14%Diet-only vs neither. Selection, not a random sip.
Mean BMI
31.5 vs 28.9Heavier on average before any model speech.
Mean age
55 vs 51Slightly older. Matters for lifetime cancer history.
ML note
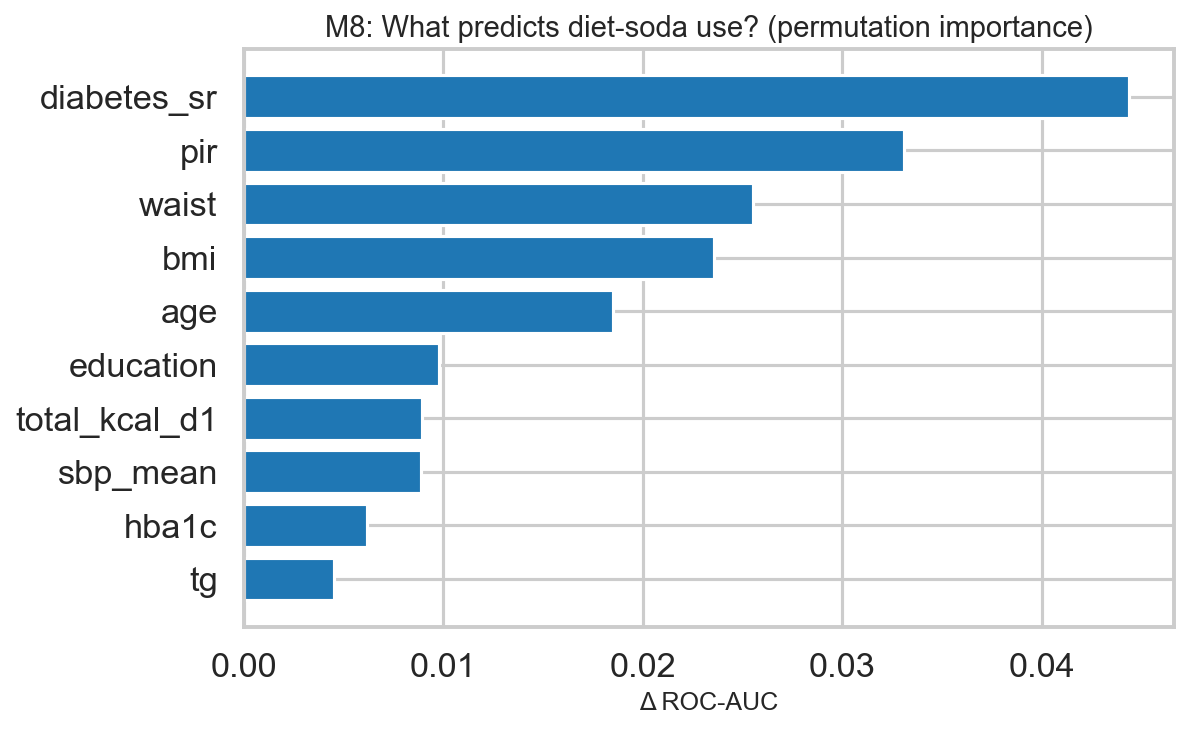
Classifier AUC about 0.66 weighted and 0.68 unweighted. That is prediction quality, not causation. Adding diet-soda features barely improves BMI prediction (ΔR² about 0.007). Small number, big point: soda flags are weak BMI predictors next to the rest of the file.
07
Models: what I ran and what held
Why model at all? Because a mean difference is cheap drama. A model is me asking: is the gap still there after I hold fixed the obvious confounders? And for diabetes markers: does it survive after I remove people who already know they have diabetes?
In one breath
I did not prove diet soda causes or does not cause anything. I ran a stress test on viral claims with public data. Crude scare that dies after controls: treat as selection noise. Gap that stays after controls: real association worth respecting, still not a trial. Cancer death that is not significant with ~27 events in the diet group: weak test, not a safety certificate.
β (beta) Average difference in the outcome for diet-only vs neither after the listed controls. BMI β +2.5 ≈ 2.5 BMI units higher.
HR (hazard ratio) Relative rate of the event over follow-up. HR 1 = same rate. CI that crosses 1 = not significant here.
S0 / S3 / S5 Crude → full lifestyle controls → same but drop known diabetes. A ladder, not three different stories.
What models can do Stress-test a claim. They cannot replace a randomized trial or lifelong intake history.
The ladder (S0 → S3 → S5)
| Step | What I did | Why |
|---|---|---|
| S0 crude | Diet-only vs neither. Almost no controls. | What a simple chart shows. |
| S3 lifestyle | Add age, sex, race/ethnicity, education, income, smoking, Day-1 calories. | Diet-soda drinkers are not demographically random. Line them up. |
| S5 no known diabetes | Same as S3, but only people who do not self-report diabetes. | Removes the reverse switch: already diabetic, already on diet soda. |
| Cox cancer death | Time from exam to cancer death (or censor). Diet-only vs neither. Age, sex, smoking. | Harder than “ever had cancer” self-report. Still short on diet-group events. |
Scoreboard: what held
| Claim under test | What the model did | What held |
|---|---|---|
| Diet soda wrecks blood sugar | HbA1c: crude → lifestyle → drop known diabetes | Mostly fell. +0.30 → +0.05. Mostly selection / reverse switch. |
| Diet soda makes you fat | BMI: crude → lifestyle → drop known diabetes | Stayed. About +2.5 (still +2.3 without known diabetes). Association, not cause proven. |
| Diet soda gives you cancer (death) | Cox HR for cancer death | Not significant. HR 0.77 (CI 0.51-1.15), p≈0.20, ~27 diet-group deaths. |
| Diet drinkers = everyone else | Profile gaps + who-drinks prediction model | Busted. Diabetes, BMI, income, age separate them. Soda flags barely help predict BMI. |
| Outcome | Step | Contrast | Estimate |
|---|---|---|---|
| BMI | S0 crude | diet-only vs neither | β +2.53 |
| BMI | S3 lifestyle | diet-only vs neither | β +2.50 |
| BMI | S5 no known diabetes | diet-only vs neither | β +2.26 |
| HbA1c | S0 crude | diet-only vs neither | β +0.302 |
| HbA1c | S3 lifestyle | diet-only vs neither | β +0.303 |
| HbA1c | S5 no known diabetes | diet-only vs neither | β +0.045 |
| Cancer death | Cox PH | diet-only vs neither | HR 0.77 (0.51-1.15) |
How to read the numbers here
BMI β about +2.5: diet-only adults sit that many BMI units higher than neither, after the listed controls. HbA1c β about +0.05: after dropping known diabetes, the remaining gap is small. Cancer HR 0.77: point estimate below 1, but the CI crosses 1 and events are few. Do not translate that into “protective” or “safe.” Standard errors are approximate (weights yes, full survey design variance no). Tiny p-values on continuous models are too flattering.
Spec curve and cycles
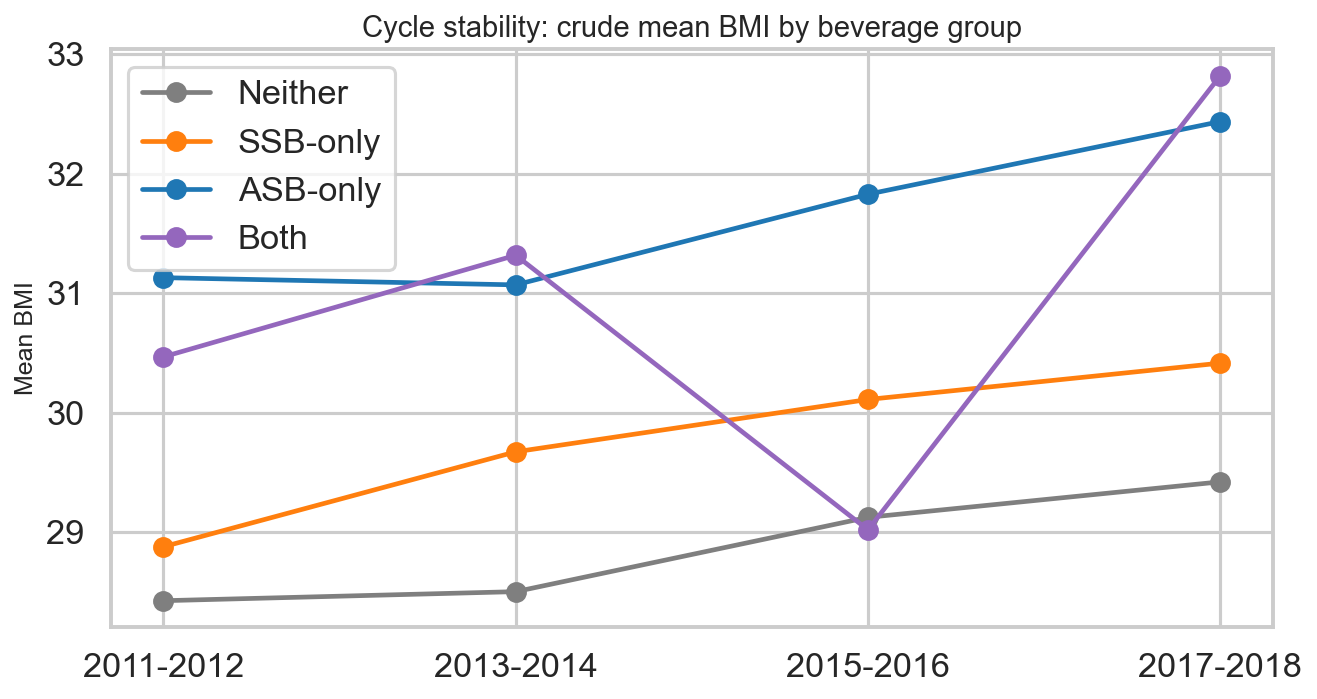
One model can be a one-off. I also show BMI across several covariate sets and across NHANES cycles so the weight result is not a single formula trick.
Dose, blood pressure, missingness
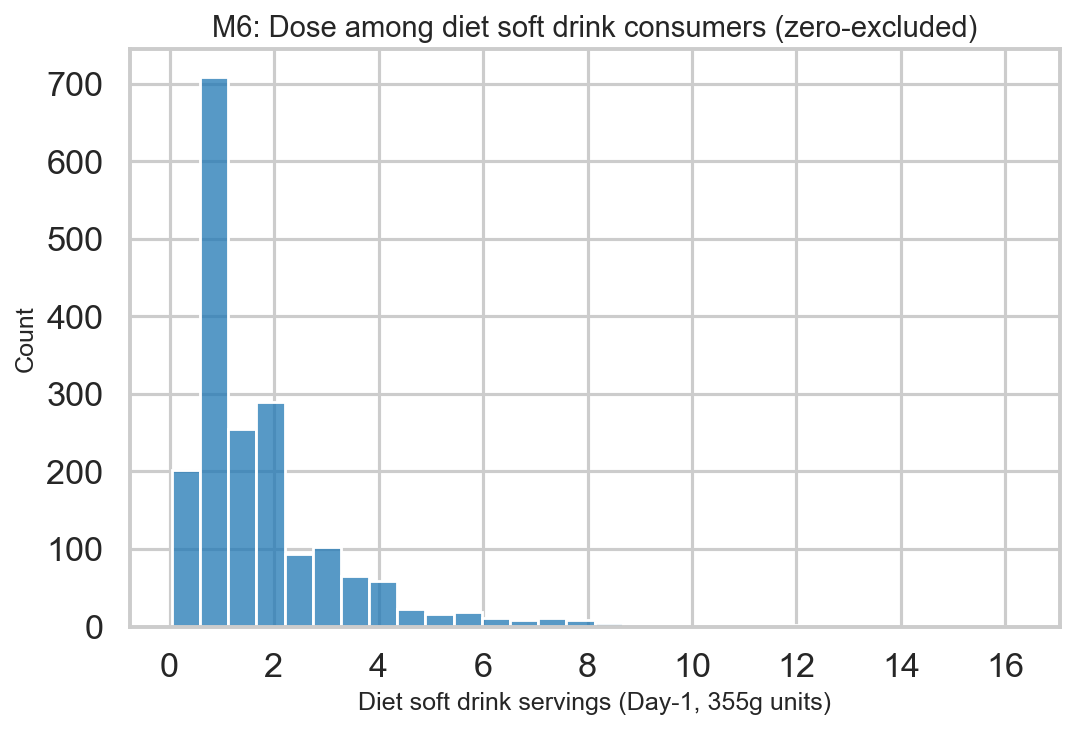
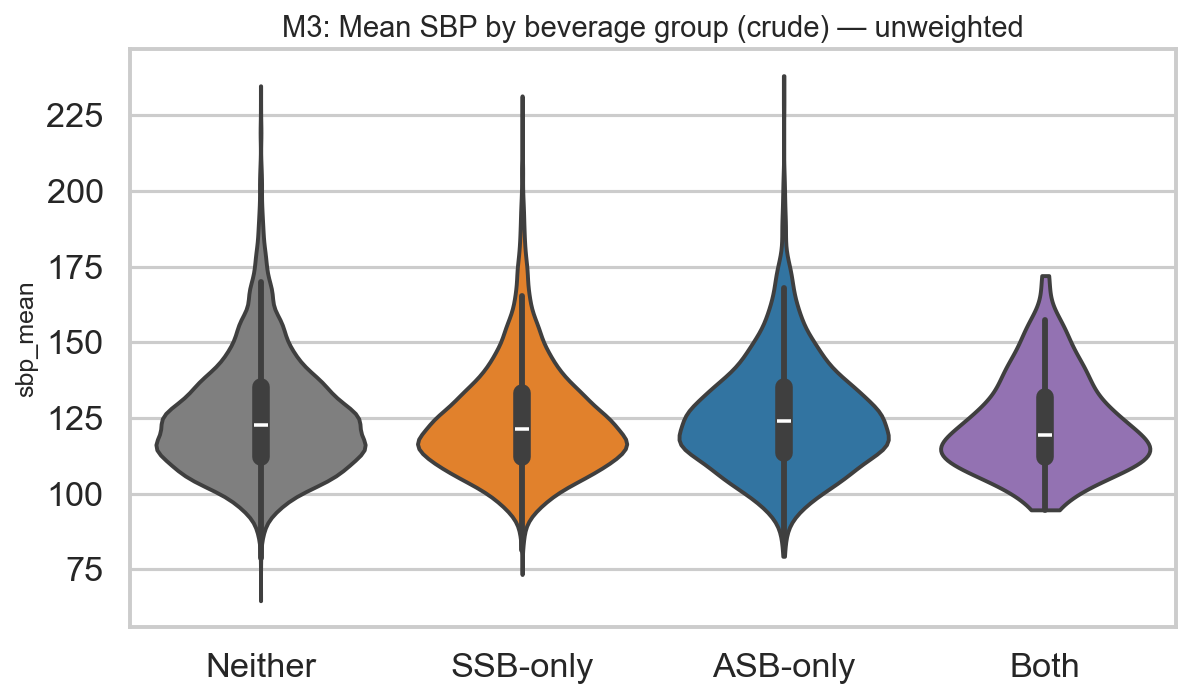
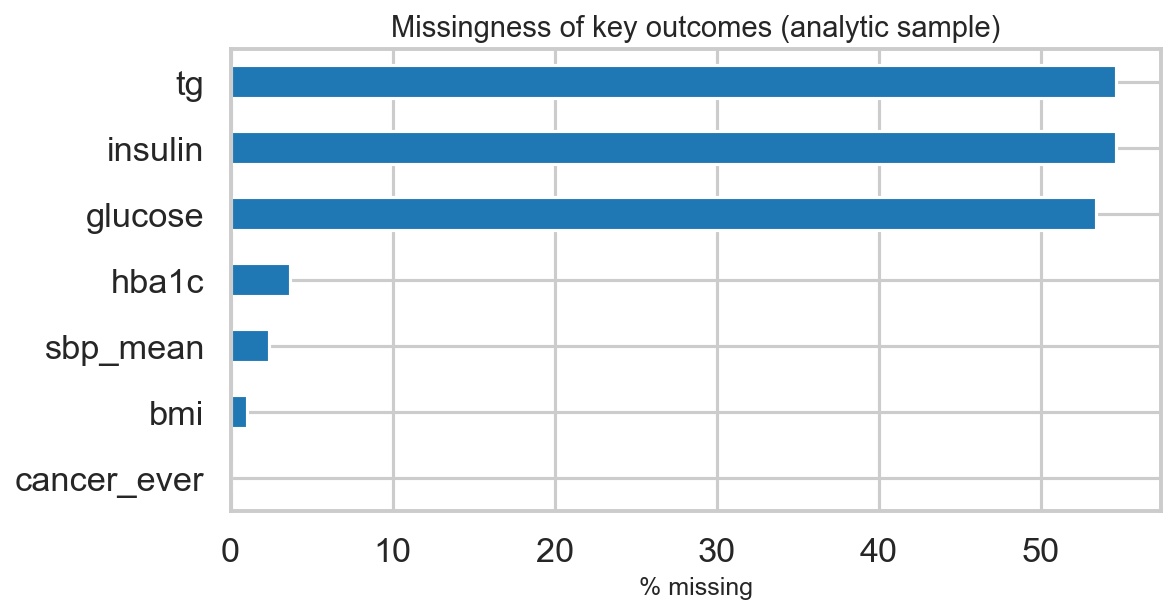
About 90% of adults have zero diet soft drinks on Day-1 recall. Continuous “per serving” models mix any-vs-none with dose among drinkers. Be careful. Triglyceride models are on log(TG). Single exam BP. Meds only partly handled.
08
How I built this
Who did the work, with what tools, and on what brief.
I pulled NHANES 2011-2018 exam, diet, and lab files. Mapped soft drinks with USDA WWEIA codes (7102 diet, 7202 regular). Linked public mortality. Built an analysis-ready sample of 19,384 adults. Ran weighted models, a small who-drinks check, a cancer pack (agencies, dose chart, age bands, survival model), and this page. Headline numbers load from the same tables I checked against the outputs.
Grok 4.5
I used Grok 4.5 as a coding partner for downloads, cleaning, models, charts, and HTML. It did not invent the NHANES rows. I still matched the big numbers to the result tables. If something is wrong, that is on me for shipping it.
First super prompt I used (compressed)
Build a portfolio-grade public Myth Lab on diet soda / artificial sweeteners. Use NHANES 2011-2018, USDA WWEIA diet soft drinks vs regular soft drinks, and NCHS linked mortality. Engineering first: clean multi-cycle sample, exclusive soda-type groups, documented weights. Test myths people actually post: cancer / WHO / aspartame, weight, diabetes, selection, microbiome if untestable say so. Verdict ladder: BUSTED, NUANCED, association only, UNTESTABLE HERE. No industry funding. No fake certainty. No “proved safe forever.” Ship charts, model ladder, cancer module, and a public write-up a coworker can defend in five minutes.
That brief turned into the repo you can reproduce below. Later prompts tightened language, fixed weight bugs, and built this article shell after an age_myth style pass.
09
Data and reproduce
NHANES continuous 2011-2018. USDA WWEIA. NCHS public Linked Mortality File.
| Piece | What I used |
|---|---|
| Exposure | WWEIA 7102 vs 7202, Day-1, exclusive soda-type groups |
| Sample | Adults 20+, not pregnant, reliable Day-1 diet, MEC weight > 0 · n=19,384 |
| Groups | diet-only 1,744 · regular-only 5,934 · both 148 · neither 11,558 |
| Mortality | 285 cancer deaths · 1198 all-cause · ~27 cancer deaths in diet-only |
| Weights | Multi-cycle MEC normalized (÷4). Binary GLM: normalized weights, never raw MEC as fake sample size |
| Money | No beverage industry funding. Public CDC / USDA / NCHS files |
cd diet-soda-analysis
python -m src.data.build_analysis_dataset
python -m src.analysis.run_eda
python -m src.analysis.run_models
python -m src.analysis.run_ml
python -m src.analysis.run_cancer_module
python -m src.analysis.run_verdicts
python scripts/handoff_smoke.py
python scripts/build_html_report.py

# outputs/tables/report_facts.json
# docs/myth_verdicts.md
Open index.html from the project root so chart paths work.
Or rebuild with --embed for a single portable file.
10
Limits
Read this before you weaponize a screenshot.
- One exam plus one day of diet recall. I cannot prove cause for obesity, diabetes, or cancer.
- I used survey weights. I did not run full multi-stage design variance. p-values are too friendly.
- Ever-cancer is self-report lifetime history. Diet is yesterday. Bad match for long cancer stories.
- Cancer death follow-up length varies by cycle. Diet-only is uncommon. Few events in that group (~27).
- No gut microbiome data. No insulin clamp. No randomized swap of sugar for diet. No organ-specific cancer registry.
- Not medical advice. If you have PKU (phenylketonuria), aspartame is a real clinical issue. Ask a clinician.
Line I would post
Diet-soda drinkers are older, heavier, and about twice as diabetic. That selection writes the crude scares. Blood sugar mostly calms after known diabetes is out. BMI stays about +2.5 as association. Cancer slogan fails. HR 0.77 with ~27 diet-group cancer deaths is not a safety certificate.
Pair 31% vs 14% with the switch story. Pair +0.30→+0.05 with the diabetes exclusion. Pair the cancer HR with the event count. Always both.