California · Florida · the West · 1992–2020 (+2025 context) · July 2026
Return to Fire
The 2017 Tubbs Fire took our home. When I started my data science career in 2020,
fires had to be my first subject. Six years later I came back to where it began — with
2.3 million fires, 308 attributes each, better methods, and AI that keeps up with my thoughts.
Portfolio analysis · public data · no API keys · offline after first download · every number machine-checked
1 in 4CA ignitions now on top-decile fire-weather days (was 1 in 13)
1 rowthe Tubbs Fire, finally in the data
01
Where this began
On October 8, 2017, the Tubbs Fire came over the ridge into Santa Rosa.
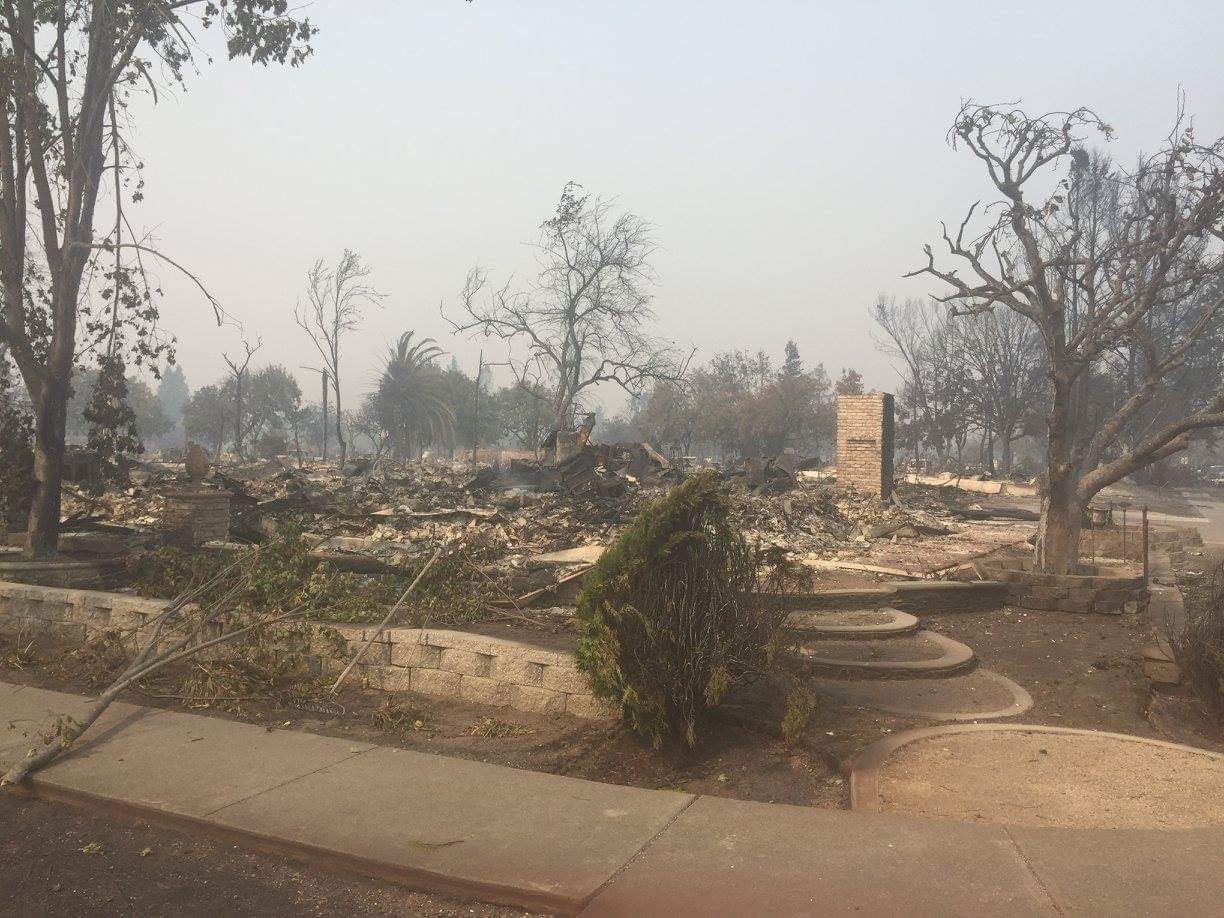
By morning our house was a chimney and a set of stone steps.
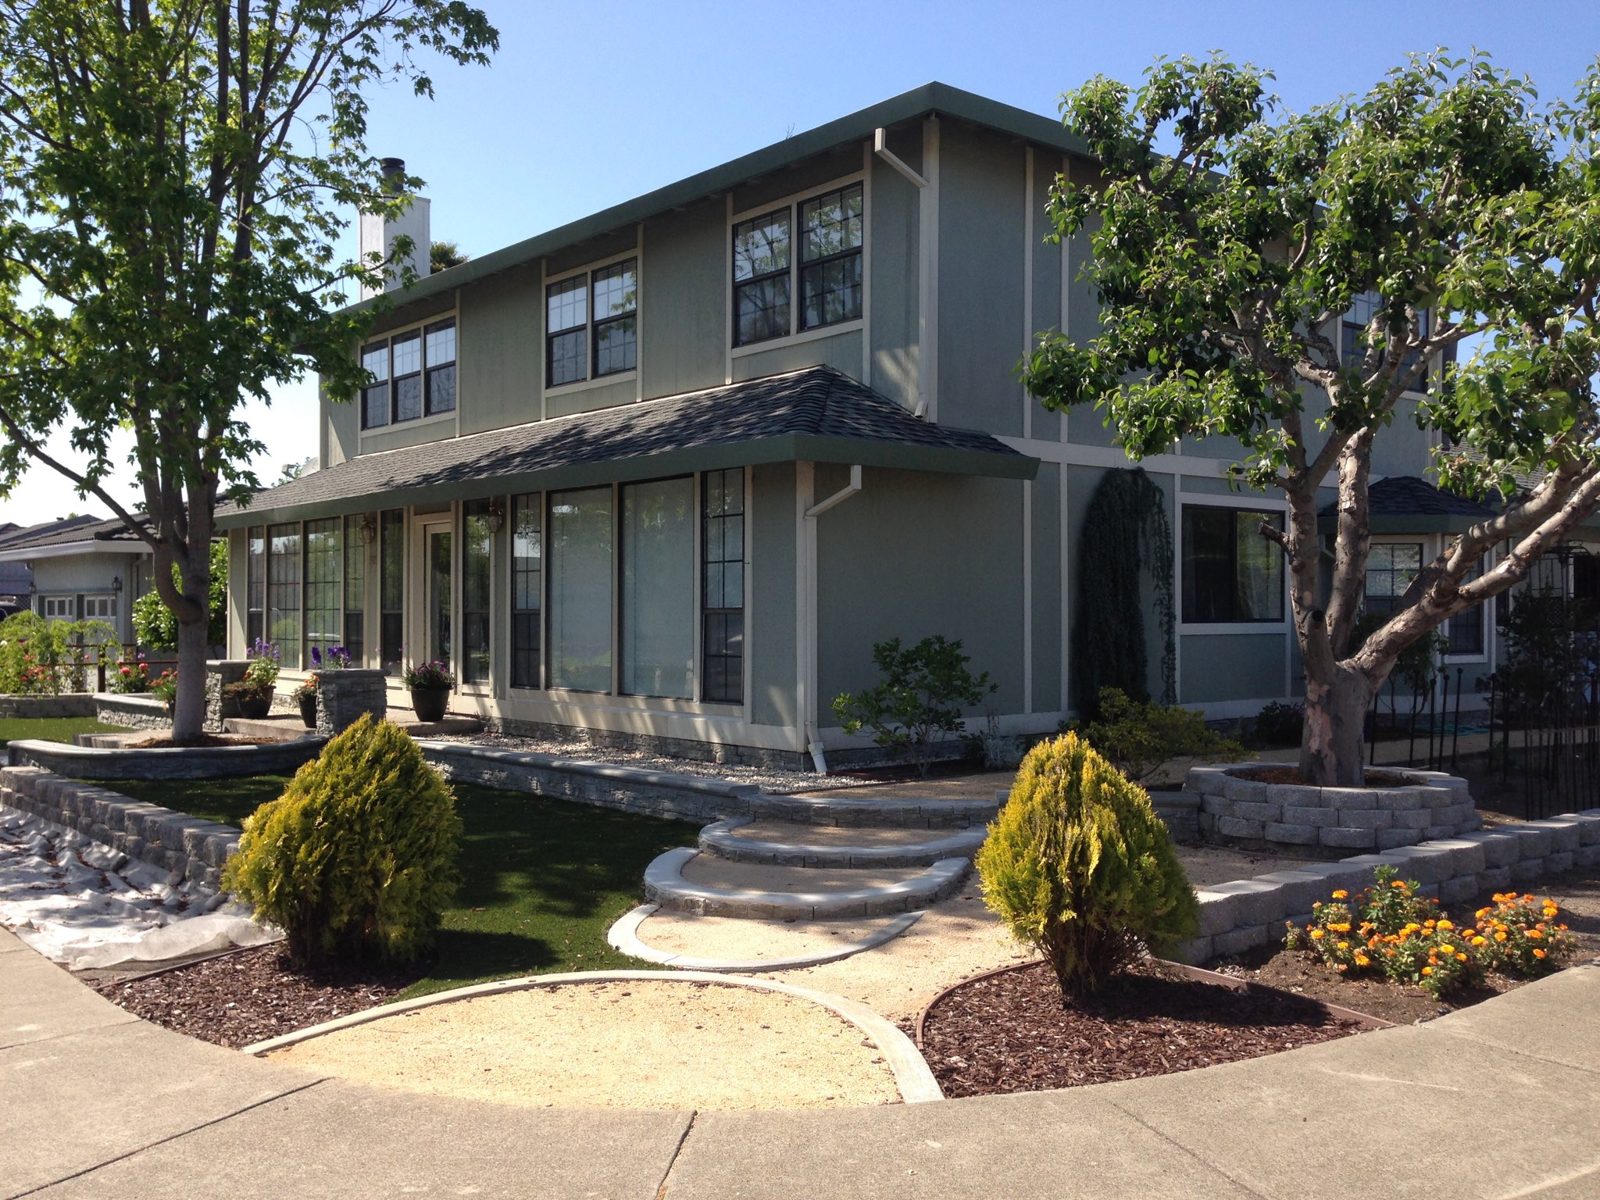
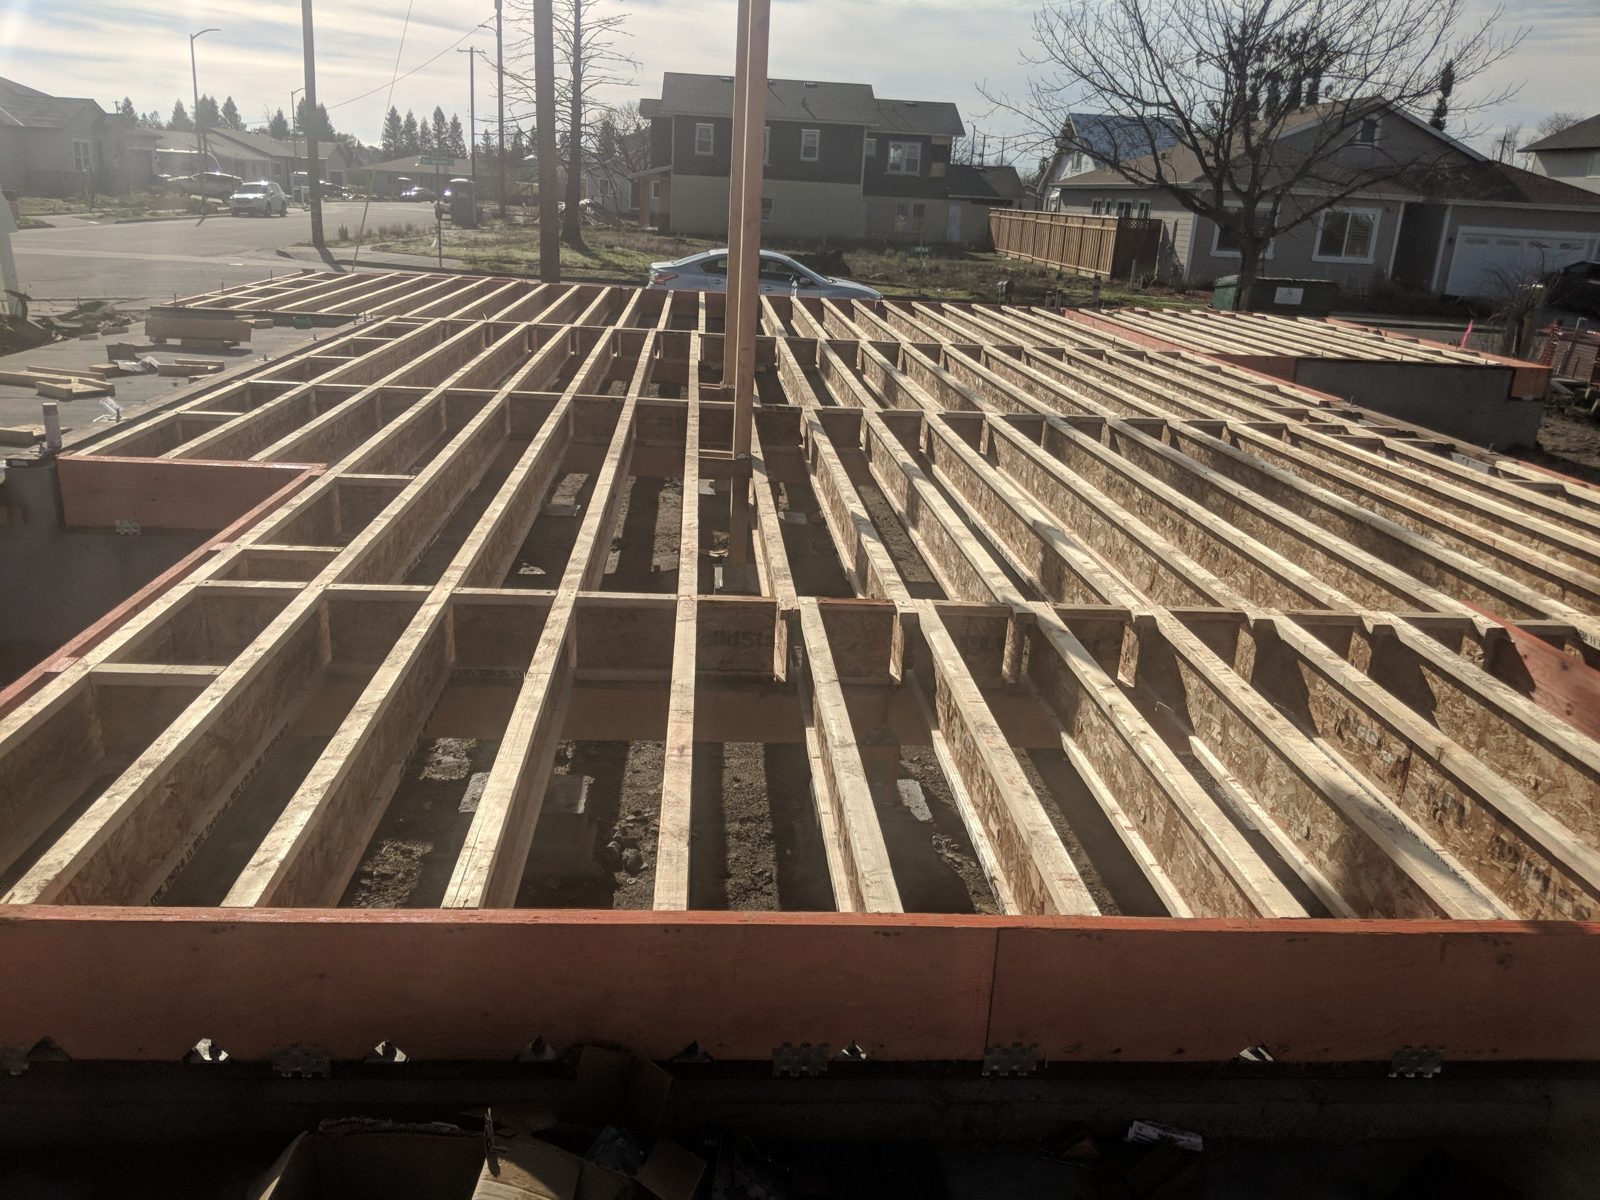
Before. The house my family rebuilt after moving in — stone walls, curved steps, the tree in its round planter.October 2017. The same curved steps. The same stone walls. Everything between them, gone. We lost about 95% of what we owned.2019. Floor joists on a new foundation, a neighborhood rebuilding around us.
That fire did not make me a data scientist. I already loved this work — the pull of a
question you can actually check. But when I sat down in early 2020 to build my first real
project, at the very start of my career, there was never a question about the subject.
It had to be fires.
I found the biggest wildfire dataset I could: 1.88 million US fires in a SQLite database.
I wrote R by hand. I wrote Python by hand. I made maps, bar charts, a random forest. I published
a three-part series and was proud of it — and I am still proud of it, because it was the
beginning of something.
Here is the detail I did not dwell on at the time: that dataset ended in 2015. The fire
that had just burned through my family's life was 22 months past the edge of the data. I was
analyzing 1.88 million fires, and the one that mattered most to me could not, by construction,
be one of them.
The database has since been updated through 2020, and a research team bolted 270 new columns
onto every record — the weather at each ignition, the dryness of the fuels, the terrain, the
people nearby. Somewhere in those 2.3 million rows is a row named TUBBS.
We will get to it.
Why this project
This is a return, not a victory lap. The 2020 series was beginner work done with care, at the
speed hand-written code allowed. Six years later I can think out loud with an AI collaborator
and watch the analysis keep pace. Same subject, same person, better tools — and the honest
question: what does a defensible version of my first project look like?
· · ·
02
TL;DR
Six findings, each with a number attached
1 · America is not having more fires. It is having bigger ones. Reported ignitions are
flat-to-noisy (Mann-Kendall p = 0.539 on the national series), while burned area rose
2.4× between the early 1990s and the late 2010s, and fires over 5,000 acres increased by
about +4 per year nationally (p = 0.007).
2 · The acres live in the giants. Fires of 1,000+ acres are 0.6% of California
ignitions and 92% of California's burned area. Any chart that draws every fire the same
size — like my 2020 maps did — hides the entire story.
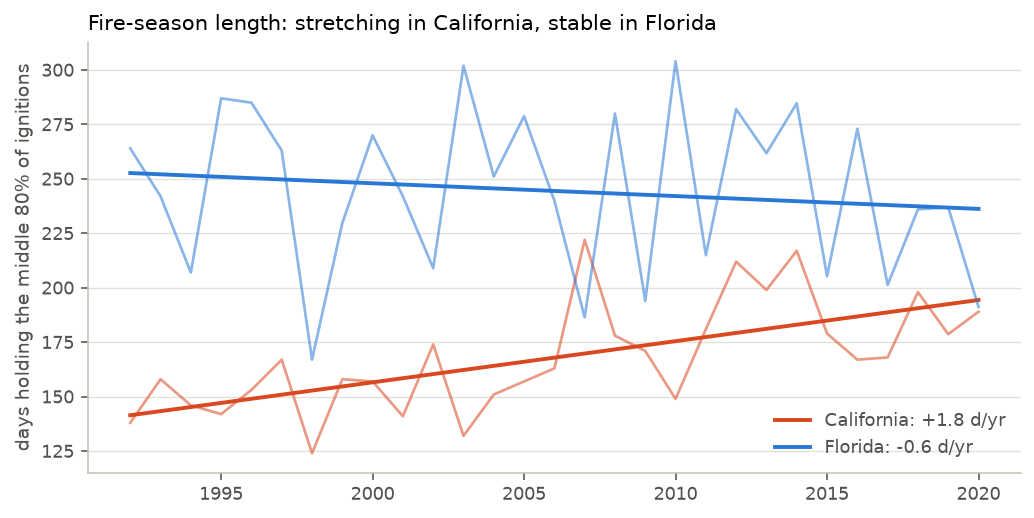
3 · California's fire calendar is stretching; Florida's is not. CA's season lengthened by
~18 days per decade (147 → 180 days holding the middle 80% of ignitions);
Florida's spring-peak season is stable-to-shrinking. My 2020 self extrapolated one state's
trend to the other. The data says they are different regimes.
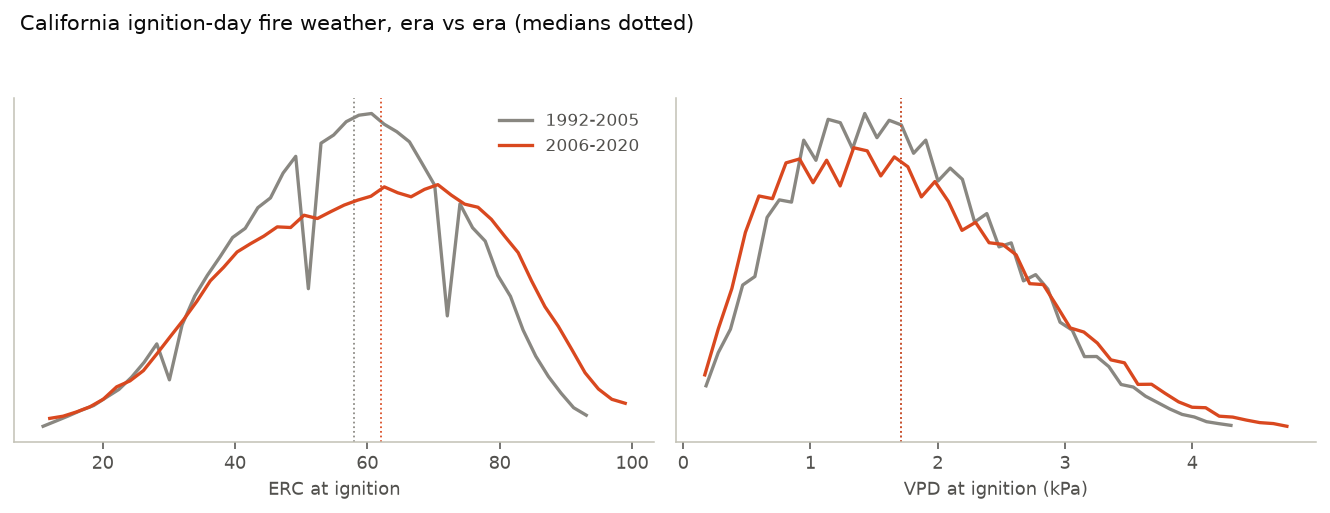
4 · Fire weather at ignition shifted where it counts: the extremes. In the 1990s,
1 in 13 CA ignitions happened on a top-decile fire-weather day (local ERC percentile).
In 2006–2020 it was 1 in 4. That is an association consistent with a warming, drying
West — this project does not do causal climate attribution, and says so plainly.
5 · Humans light the fires; lightning burns the acres. People start 84.5% of
known-cause fires, but natural ignitions account for 65% of Western burned area.
6 · My 2020 model's 94.7% was mostly a majority class plus memorized coordinates.
Rebuilt faithfully, its celebrated campfire accuracy (96.0%) sits next to a
guess-the-majority baseline of 95.7%. The honest 2026 model — at-ignition features
only, tested on years it never saw — scores macro-F1 0.870 against a climatology
baseline of 0.787, and its probabilities are calibrated (Brier 0.096).
And the row exists now. Discovery date 2017-10-08, Napa County,
36,807 acres, minimum humidity 6.3%, ERC above the 90th local percentile. The data caught up
to the story.
· · ·
03
What 2020-me built
Three parts, written by hand at the start of a career: an R/ggplot exploration, a
leaflet map tour, and a scikit-learn random forest. The originals stay online, unedited.
Respect first, because it is deserved. 2020-me picked a genuinely hard dataset — 1.88M rows
in SQLite, not a tutorial CSV — and handled the database boundary correctly, closing
connections and explaining why. Every figure got a paragraph of interpretation; nothing was
dumped and abandoned. The maps used a proper Albers equal-area projection, which plenty of
working analysts skip. And buried in Part III is one sentence of real instinct:
"I am going to drop a lot of the variables that are known after the fire. I want to see if we
can predict the cause of fire by just the Latitude, Longitude, Month, year, and day of week."
That is leakage awareness, unprompted, self-taught, in 2020. The instinct was right — it just
was not applied everywhere, and the features it trusted were quietly broken. Which brings us to
the bug.
The bug that ate two features
Part III's notebook says, in prose: "DISCOVERY_DATE variable is in the Julian Date format.
I want to convert this variable to Gregorian dates." The very next cell runs:
pd.to_datetime read those Julian day numbers (~2,453,000) as
nanoseconds since 1970. Every fire in the dataset became January 1, 1970 — a Thursday.
MONTH was 1 for every row; DAY_OF_WEEK was 3 for every row. Two of the five features feeding
every model were constants, and nothing errored. The fix was one argument:
pd.to_datetime(col, unit="D", origin="julian"). The stated intent sat
one cell above the code that betrayed it.
The other 2020 problems, briefly and specifically:
The headline conclusion outran the analysis. "It does seem climate change is a strong
cause of this" rested on one straight trend line through raw annual counts — no climate
variable existed anywhere in the data, and (as we will see) raw counts partly measure paperwork.
The 94.7% was never questioned. A random 70/30 split let the model memorize
coordinates; campfires were rare enough that guessing "not campfire" scored ~93%. Two other
models landed on exactly 0.9000 and the notebook celebrated rather than squinted.
Model 1 leaked. Predicting cause with FIRE_SIZE and containment dates in the feature
set is using the aftermath to predict the beginning.
Every fire was the same dot. A 1,200-acre fire and a 300,000-acre fire rendered
identically on every map.
The Florida section had a header, a figure, and zero sentences. It gets its words
this time.
None of this is disqualifying for a first project. It is a starting line. The rest of this page
is the same questions, asked the way I would ask them now.
· · ·
04
The data, upgraded
Same national fire registry, two major versions later — plus 270 new columns of
physics, fuels, terrain, and people attached to every single fire.
The backbone is the Fire Program Analysis Fire-Occurrence Database (FPA-FOD), the
interagency registry of every reported wildfire in the US. My 2020 project used its 2015 edition
via Kaggle. The current 6th edition runs 1992–2020 with 2.3 million fires. On top of it,
the FPA FOD-Attributes dataset (Pourmohamad et al., 2024; Zenodo
10.5281/zenodo.8381129, CC-BY) attaches ~270
attributes to each record: gridMET fire weather on the discovery day (temperature, humidity,
wind, vapor-pressure deficit, ERC), 5-day antecedent windows, local climatological percentiles,
NDVI and land cover, elevation/slope/aspect, population, social-vulnerability indices, distances
to fire stations. It is 29 annual CSVs, 4.68 GB raw, 308 columns wide.
Download once29 per-year CSVs from Zenodo, md5-verified, resumable. The 5 GB blob variant is skipped on purpose.
Discover columnsEvery curated column is verified present in every year file before any row is read. Missing → loud failure, not a guess.
Lock with hashesEvery cache is SHA-256-manifested. Silent drift fails loud — a lesson the 1970 bug taught for free.
Assert the bug awayParsed dates must span 12 months and 7 weekdays and match FIRE_YEAR. The 2020 degeneracy is now a crash, not a surprise.
Technical
The reducer re-derives month, weekday, and a leap-safe day-of-year from properly parsed dates
(checked: 12/12 months, 7/7 weekdays, year-mismatch 0.0017%). If DISCOVERY_DATE ever arrives
as Julian day numbers again, the pipeline applies
pd.to_datetime(col, unit="D", origin="julian") — the one-argument
fix — and still runs the assertions. Sentinel values (-9999) become NaN. The full resolved
column mapping ships in data/reduce_report.json.
The 2021–2025 extension. FPA-FOD ends in 2020, which would leave this rebuild six years
behind the present. For the large-fire context series only, I pull annual aggregates (counts and
acres of 1,000+ acre wildfires) from NIFC's WFIGS perimeter service. It is a different reporting
system with different completeness, so it is drawn as a dashed, visibly separate segment, never
mixed into the models, and never used for trend tests across the seam.
Honest scope notes: the attributes dataset covers the contiguous US — Alaska and Hawaii,
which my 2020 national maps included, are absent here and that matters for national acreage
(Alaska burns big). Cause is missing or undetermined for 8.4% of fires nationally — and for
30.8% of California-plus-Florida fires, which constrains every cause model downstream.
· · ·
05
The full look
Part I's job, done the 2026 way: before any model exists, characterize what the
table actually delivers — including what is missing, and where the registry itself changes shape.
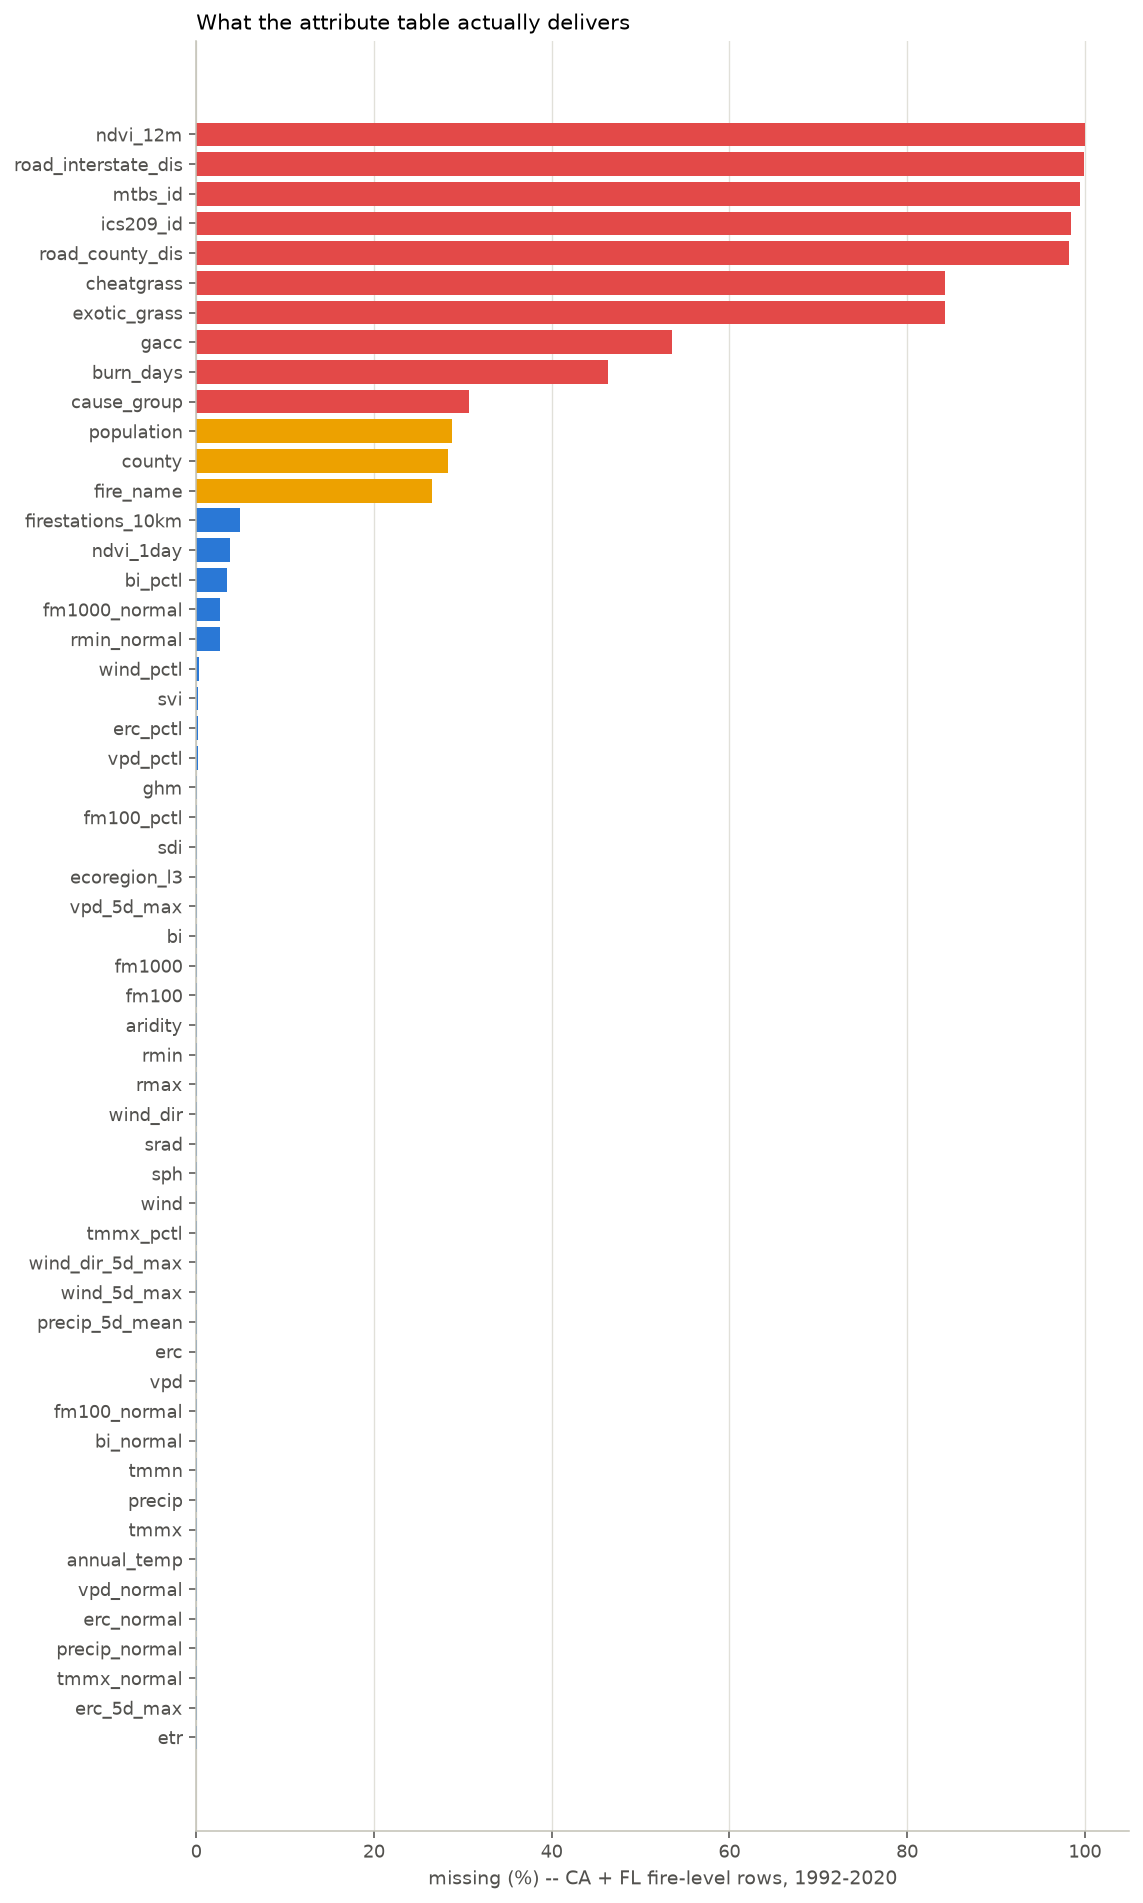
Trust, but verify the columns. Three advertised attributes are effectively dead in CA/FL
(12-month NDVI 100% missing; both road-distance columns >98%) and were dropped from all models.
Weather attributes are near-complete (<0.1% missing). Cause is the big honest gap: 30.8% of
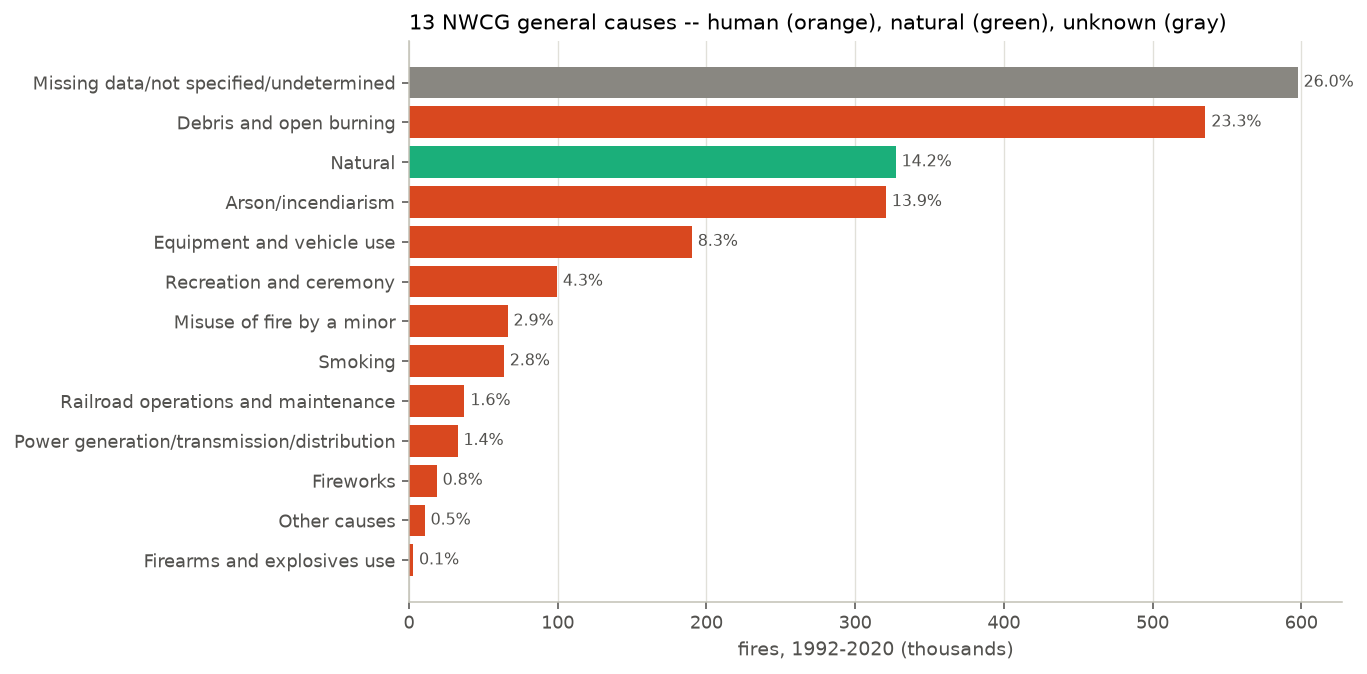
CA+FL fires have no usable cause label.The taxonomy changed under the project. The 2015-era 13 causes (Campfire, Children,
Powerline...) were retired for NWCG's classification. Debris burning leads, lightning is the
only natural cause, and "missing/undetermined" is large enough that any cause model must
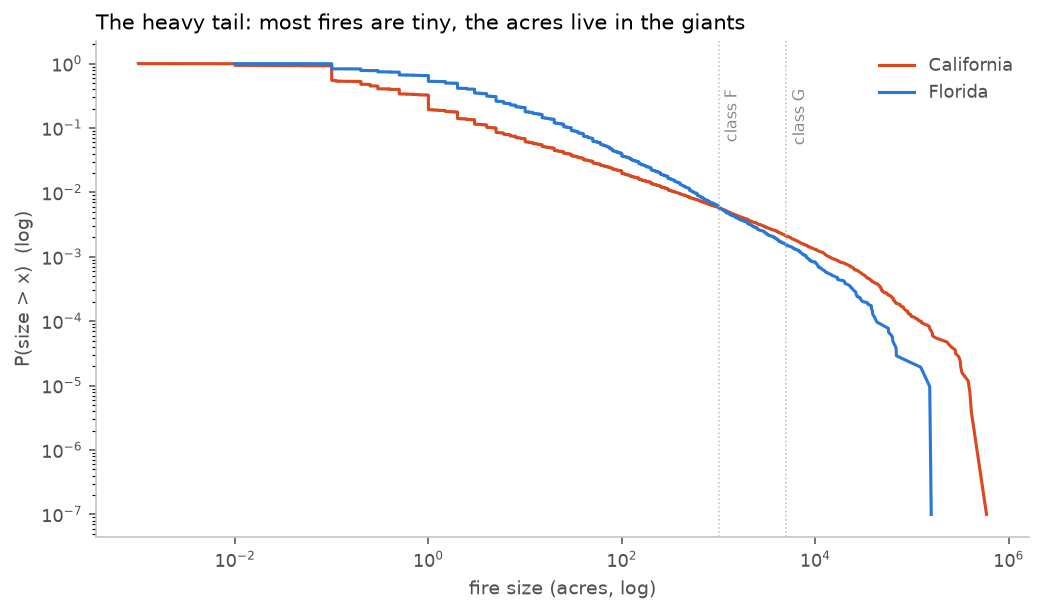
report what it excluded.The heavy tail is the whole ballgame. Straight-ish lines on log-log axes across five
orders of magnitude. Large fires (1,000+ acres) are 0.6% of CA ignitions — and 92% of CA burned
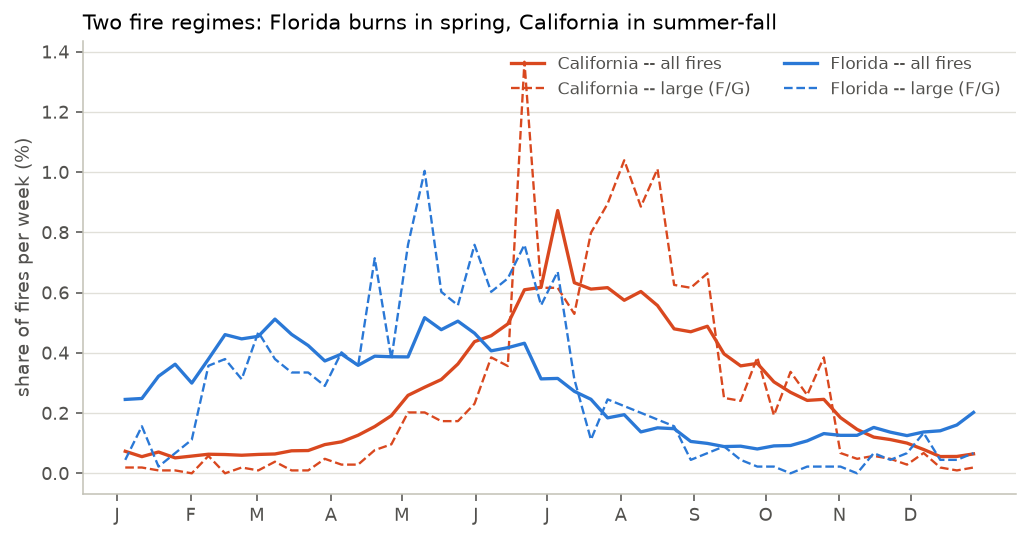
acres (71% in FL). This single chart indicts every equal-dot map I made in 2020.Two states, two calendars. Florida burns in spring (May peak); California peaks in
July–August, and its large fires skew later into the fall wind season. This two-regime
structure is why extrapolating CA conclusions to FL failed in 2020.
Plain English
Before asking "are fires increasing?", we checked what the ledger can honestly answer. The
weather physics attached to each fire is nearly complete and trustworthy. The cause labels are
good but gappy. And the number of reported small fires depends partly on who was doing
the reporting in a given state and year — which is exactly where 2020-me got burned.
· · ·
06
Six bets, placed before the verdicts
Each hypothesis was written down with a decision rule; the lab fills in the verdict
chips from trend_lab_results.json. Not all of them survived — including
two claims 2020-me treated as obvious.
H1 · "Wildfires are increasing in the US"
2020's framing premise, tested on counts and burned area.
SPLIT
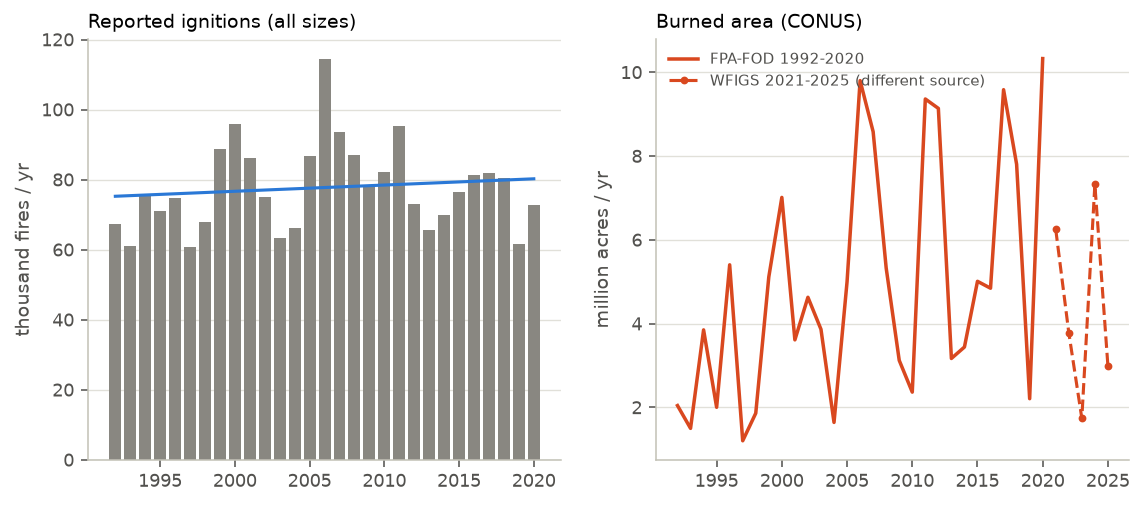
Ignition counts: flat (MK p=0.539). Burned area: up 2.4×. More fire, not more fires.
H2 · The West is burning bigger
Burned area and large-fire activity across 11 Western states.
CONFIRMED
West acres up (MK p=0.018); 5,000+ acre fires up nationally +4.2/yr (p=0.007); West large-fire counts up in the panel model (IRR 1.14/decade, p=0.007).
H3 · CA ignitions on increasingly extreme fire-weather days
Association, not attribution — measured at the extremes, where it matters.
H6 · "Large fires are increasing everywhere, including Florida"
2020's extrapolation from California to Florida.
REJECTED
FL large-fire trend: IRR 0.99/decade (CI 0.72–1.36), MK p=0.612. Florida is a different fire planet.
Why bets
Writing hypotheses before results is cheap insurance against narrating whatever the charts
happen to show. Two rules were revised once, on principle, after the first run — that story is
told openly in the defense section, because it is exactly the kind of
thing a skeptical reviewer should get to see.
· · ·
07
California: not more fires — more fire
The state's large-fire count trend is statistically unremarkable. Everything
else about its fire behavior changed.
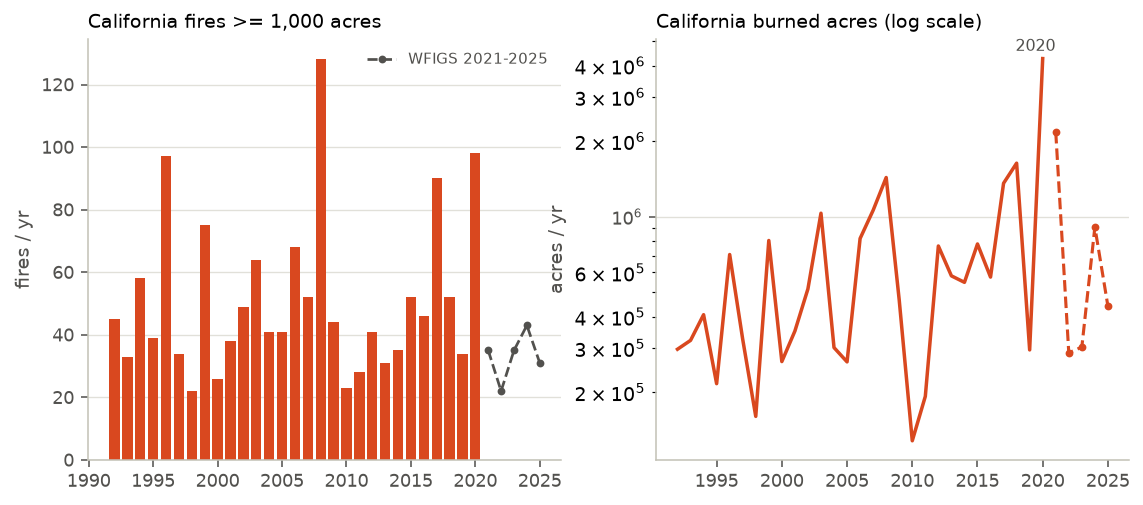
Counts wobble; acres explode. Left: CA fires ≥1,000 acres per year (IRR 1.07/decade,
CI 0.89–1.29 — not a significant count trend), with the 2021–2025 WFIGS series dashed and
separate. Right: burned acres on a log scale — 2020 alone burned 4.27M acres, and the
Theil-Sen slope is +21k acres/yr (MK p=0.018).The stretching calendar. The window holding the middle 80% of CA ignitions grew from
~147 days (early 1990s) to ~180 days (late 2010s): +17.8 days per decade (MK p=0.0002).
Florida, plotted on the same axes, drifts the other way.The extremes moved; the middle mostly didn't. ERC at ignition shifted right (median
58 → 62) and the top-decile share nearly quadrupled, while the VPD median barely moved.
ERC integrates weeks of fuel drying — drought memory — which is exactly what California's
2012–2020 stretch supplied.
Plain English
Think of it this way: California is not getting struck by more matches. The matches are
landing on a landscape that spends far more of the year ready to burn — and when one lands on
the wrong autumn day, wind does the rest. That is the story the next section's map tells.
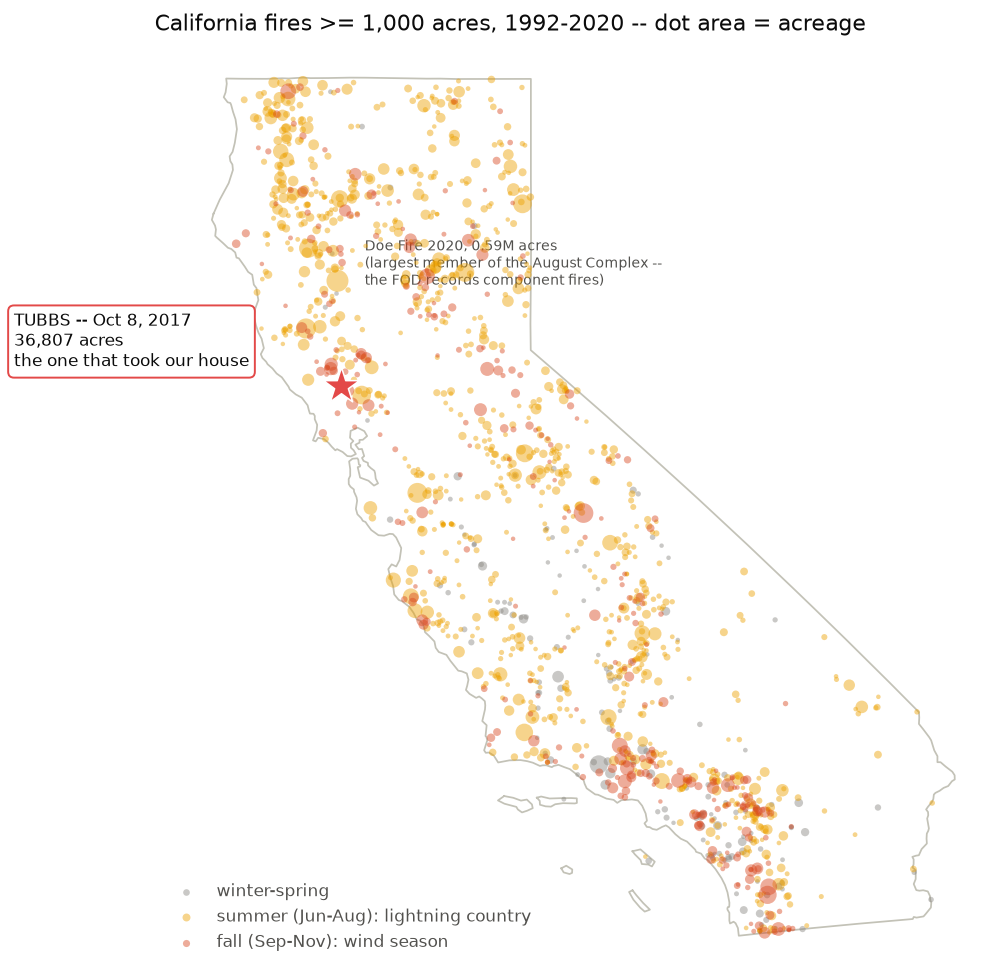
Every dot's area is its acreage — the fix my 2020 maps needed. Summer lightning fires
(gold) fill the Sierra and the north; the fall wind season (orange-red) hugs the coast ranges
and Southern California. Fall fires are 21% of CA's large fires but 26% of their acres, and
they are the ones that reach towns. The star is Tubbs. The Doe Fire annotation is a data
detail worth knowing: the FOD records the August Complex as its component fires.
· · ·
08
The row
FOD_ID 400015986. In 2020 this record did not exist to be found. Here is what the
database now holds for the night everything burned.
Field
Value
What it means
FIRE_NAME
TUBBS
one row among 2,302,521
DISCOVERY_DATE
2017-10-08
day 281 — deep in the wind season
FIRE_SIZE
36,807 acres
class G; 20 days to containment
ignition point
38.60895, −122.62879
Napa County, near Calistoga — it crossed into Sonoma and came down on Santa Rosa
NWCG cause
Human / undetermined
see note below
rmin
6.3%
minimum relative humidity that day — desert-dry air in wine country
vpd
2.22 kPa
vapor-pressure deficit far above the CA ignition median (1.71)
erc / percentile
77 · >90%
energy-release component in the top decile of that location's own climatology
tmmx
86°F
a warm day, not a heat record — heat wasn't the weapon; dryness and wind were
wind (daily mean)
6.0 m/s
gridMET is a daily 4-km average — the Diablo gusts that night ran far higher, and the row cannot see them
Read the weather columns again. Bone-dry air, fuels at a top-decile energy state, and a wind
field the daily average can only hint at. The row is the Diablo-wind signature written into a
database — the same pattern the seasonal map shows for nearly every autumn disaster on the
California coast ranges.
On the cause field
The database says Human / undetermined. CAL FIRE's 2019 investigation attributed the ignition
to a private electrical system beside a residence — consistent with "human," never resolved to
a specific NWCG category in this registry. My 2020 writeup once garbled this into a sentence
about lightning. The record, and the correction, both stand here.
You can print this row yourself, offline, in one command:
python examples/find_tubbs.py.
· · ·
09
Florida, which finally gets its paragraphs
In 2020 the Florida section was a header and an unexamined image. It deserved
better: Florida is the clearest counterexample to every "fires are exploding everywhere" take.
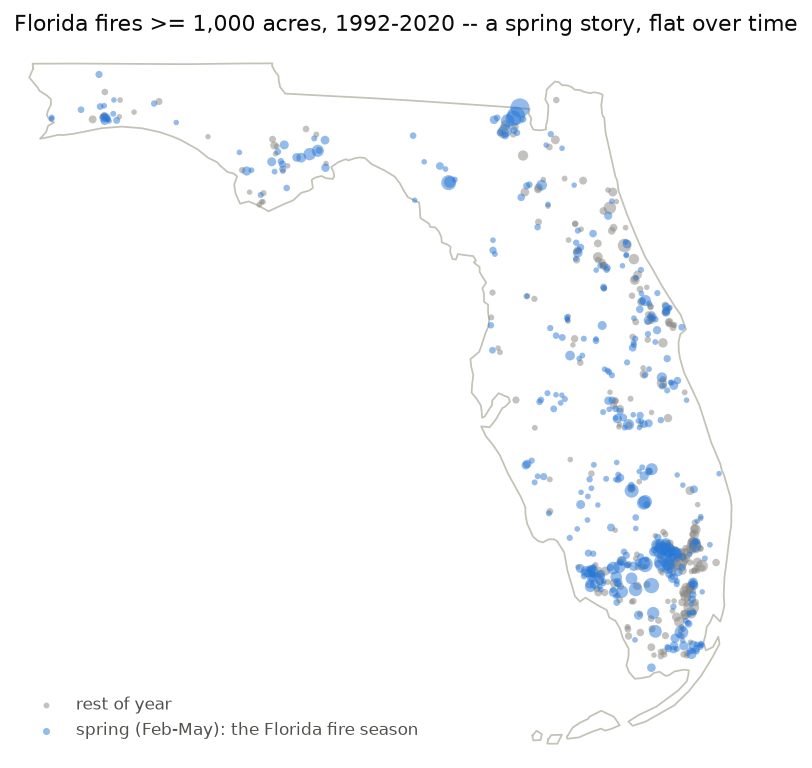
A spring story, flat over time. 57% of Florida's 640 large fires ignite February–May,
between the dry season's end and the summer rains — concentrated in the interior flatwoods and
the Everglades margins.
Florida burns constantly and on purpose: it runs one of the country's largest prescribed-burn
programs, and its ecosystems are built to burn frequently and lightly. Its large-fire count
trend over 29 years is a flat line (IRR 0.99/decade, MK p=0.612); its burned-area trend is
indistinguishable from noise (MK p=0.468); and its fire season, if anything, contracted
(257 → 228 days era-over-era, not significant).
So H6 — the 2020 claim that large wildfires were rising "across the U.S. and across California
and Florida" — is rejected, and the rejection is the insight: the American fire problem is
not a uniform national trend. It is a Western drying story, and Florida's stability is the
control group that proves the point.
· · ·
10
The national picture, with the paperwork removed
2020-me fit one line through national counts and read climate into it. The honest
version has to separate physics from reporting first.
The claim 2020-me should have made. Left: reported ignitions, flat-to-noisy.
Right: burned area — from ~3.3M acres/yr (1992–96) to ~7.9M (2016–20), with 2021–2025
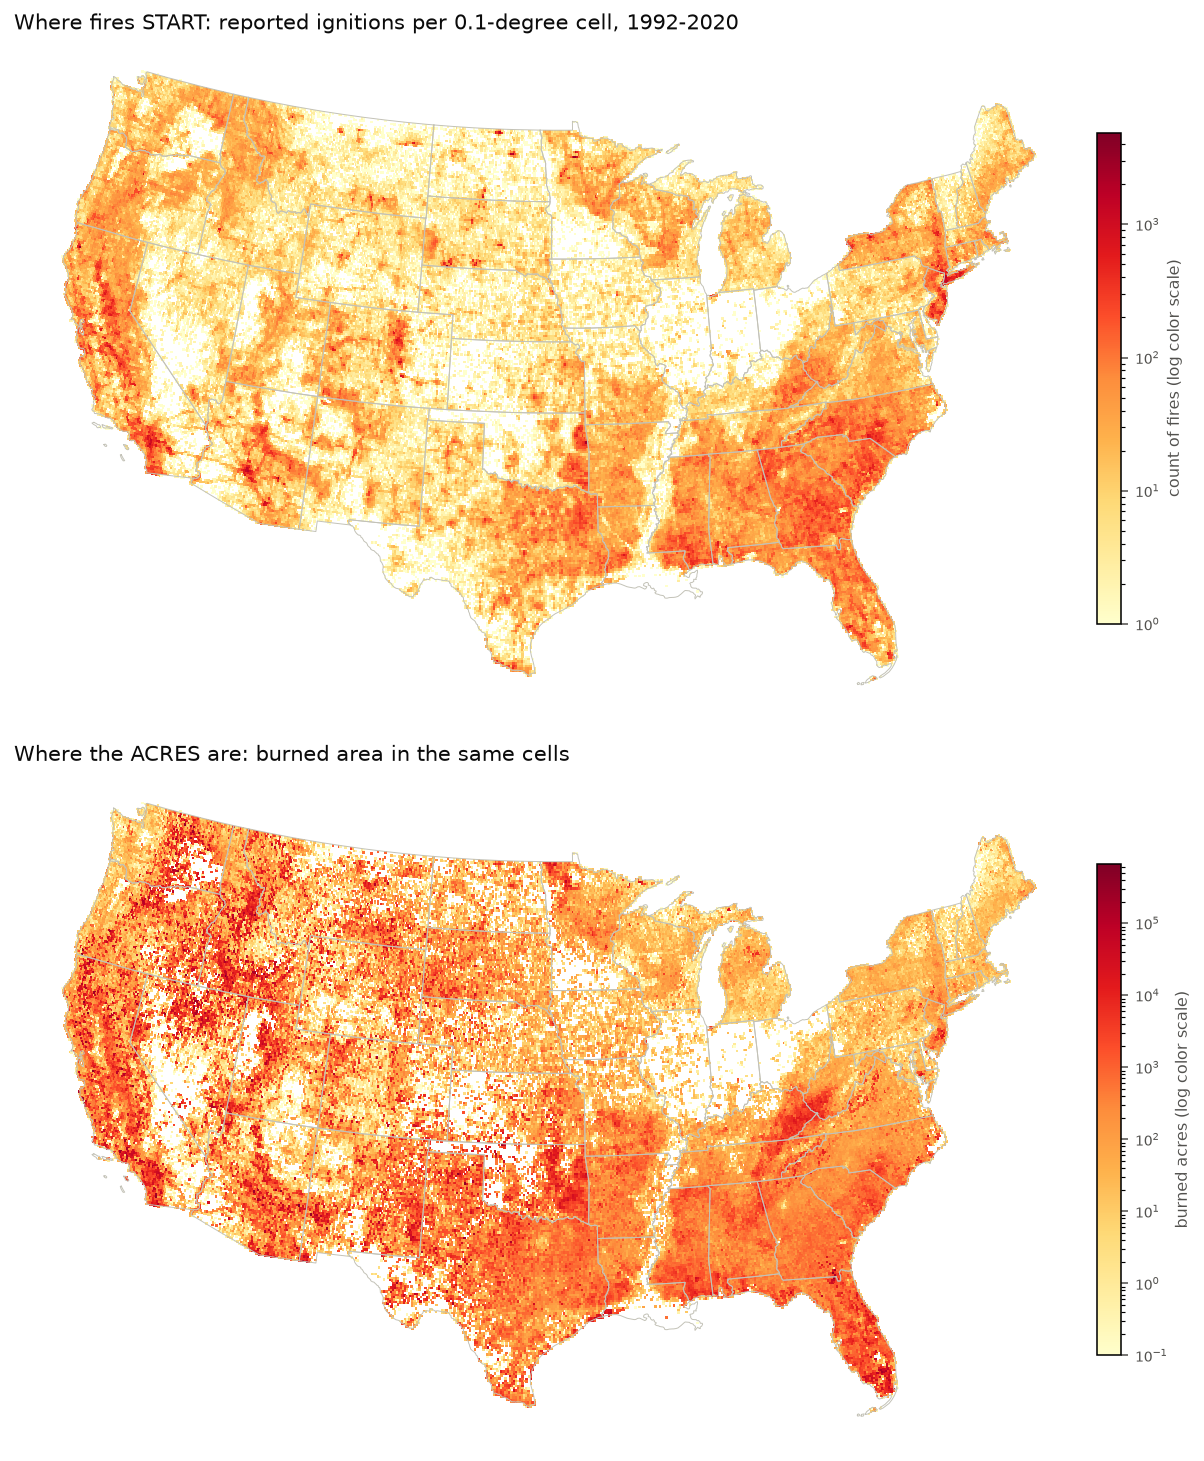
dashed from a different source and not used in any test.Where fires start vs where the acres are. By count, the Southeast dominates — a
dense drumbeat of small human ignitions. By acreage, the map inverts and the interior West
lights up. Same cells, same projection, opposite stories — the count/consequence distinction
my 2020 choropleths could not draw.
Data detail that mattered
The state-level panel model says ignition counts rose (+23%/decade) while the national summed
series says flat (MK p=0.539). Both are computing honestly — the panel is dominated by
states whose reporting grew. Massachusetts, Kansas, Louisiana, and Tennessee show
step-changes of 40–300× in year-over-year reported counts; Puerto Rico's series is so
discontinuous it is excluded from every national figure on this page. A trend you can flip by
changing which paperwork you count is not a physical trend.
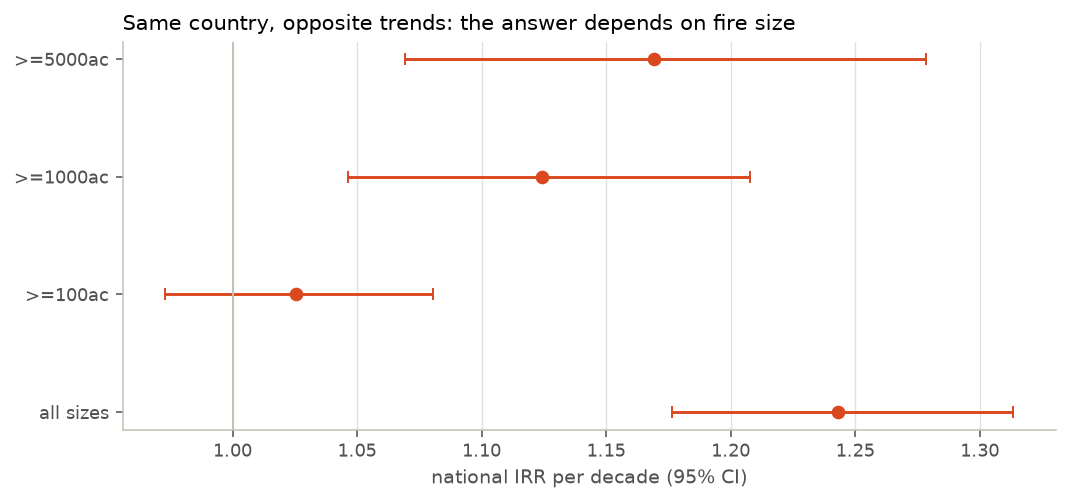
Same country, opposite answers by size class. The national count trend is large and
positive for all sizes (reporting-sensitive), shrinks as the size floor rises, and what remains
at 5,000+ acres — where reporting has always been complete — is the physical signal: about
+4 giant fires per year, per decade.
The 2021–2025 extension adds current-events context without contaminating the statistics: the
WFIGS years include the quiet 2022–2023 lull and the ferocious 2024; January 2025's Los Angeles
fires (Palisades, Eaton) barely register in acres — and were among the costliest disasters
in state history, a reminder this page returns to in Limits: burned area is
not damage.
· · ·
11
The model lab: a museum piece and an honest machine
First rebuild the 2020 random forest exactly as it was — dead features, leaked
outcome, random split — then sit it next to models evaluated the way 2026 requires.
The museum piece
Faithfully reconstructed on 1992–2015 California large fires (the old 13 cause classes
approximated from NWCG's new taxonomy): the same RandomForest settings, the same random 70/30
split, MONTH pinned to 1 and DAY_OF_WEEK to Thursday exactly as the Julian bug left them, and
FIRE_SIZE left in the features exactly as the leak allowed. It scores
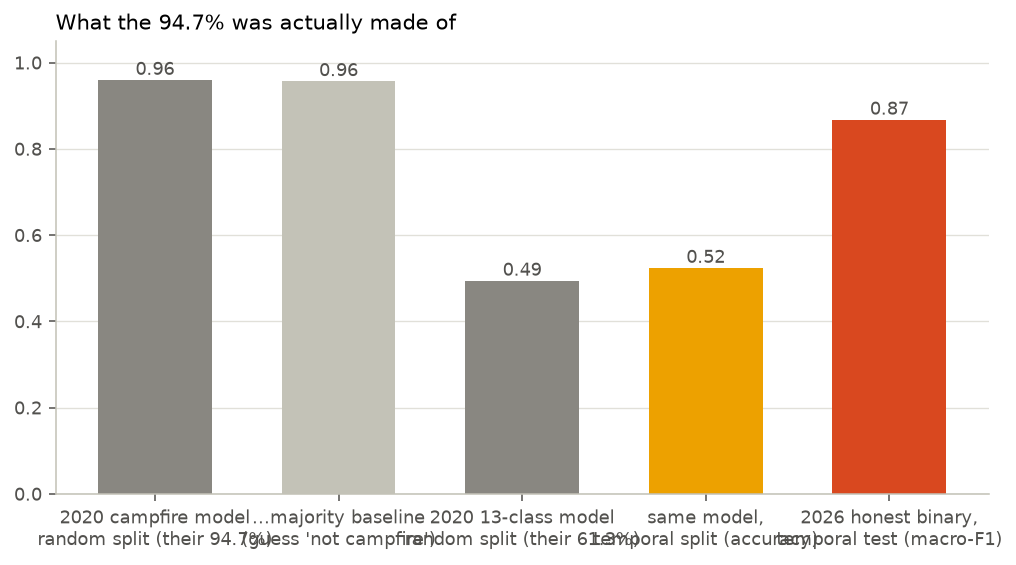
49.4% on the 13-class task (the 2020 notebook reported 61.3%) and
96.0% on the celebrated campfire binary (2020: 94.7%) — against a
guess-the-majority baseline of 95.7%. Re-scored under a temporal split, the
13-class museum model's macro-F1 is 0.14.
What the 94.7% was actually made of. Mostly prevalence, plus coordinates the random
split let the forest memorize. The honest bar is a different metric on a harder question —
which is the point.
The honest machine
Gradient boosting (scikit-learn's HistGradientBoosting — native missing-value and categorical
handling, no extra dependencies) on at-ignition features only: location, calendar
(computed correctly this time), the fire weather of the day, fuel moisture, vegetation, terrain,
and human presence. Named and excluded: FIRE_SIZE, size class, containment anything, agency,
owner — if it isn't knowable at ignition, it isn't a feature. Cause labels are missing for
15.2% of CA fires; those rows sit out and that share is reported, not hidden.
Protocol: train ≤2014, validate 2015–2017, test 2018–2020 — the model never sees
the era containing Tubbs. Inside the training era, 5-fold spatial-block cross-validation
(1°×1° blocks) checks that scores survive when nearby fires can't leak across folds.
Three baselines every model must beat: majority class, a groupby climatology (majority cause per
0.2° cell × month), and a linear model.
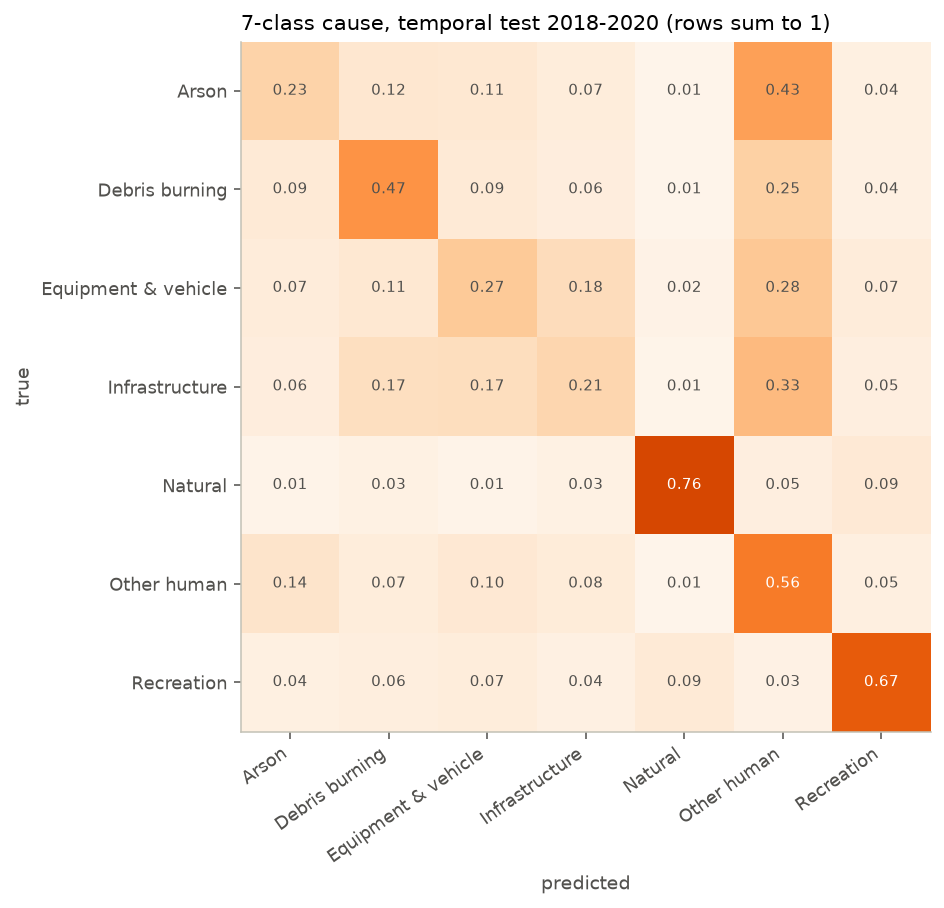
Where cause prediction is honest about its limits. Lightning separates cleanly from
people (weather and terrain give it away). Distinguishing arson from debris burning from
equipment — different humans with different matches — is where the signal thins, exactly as the
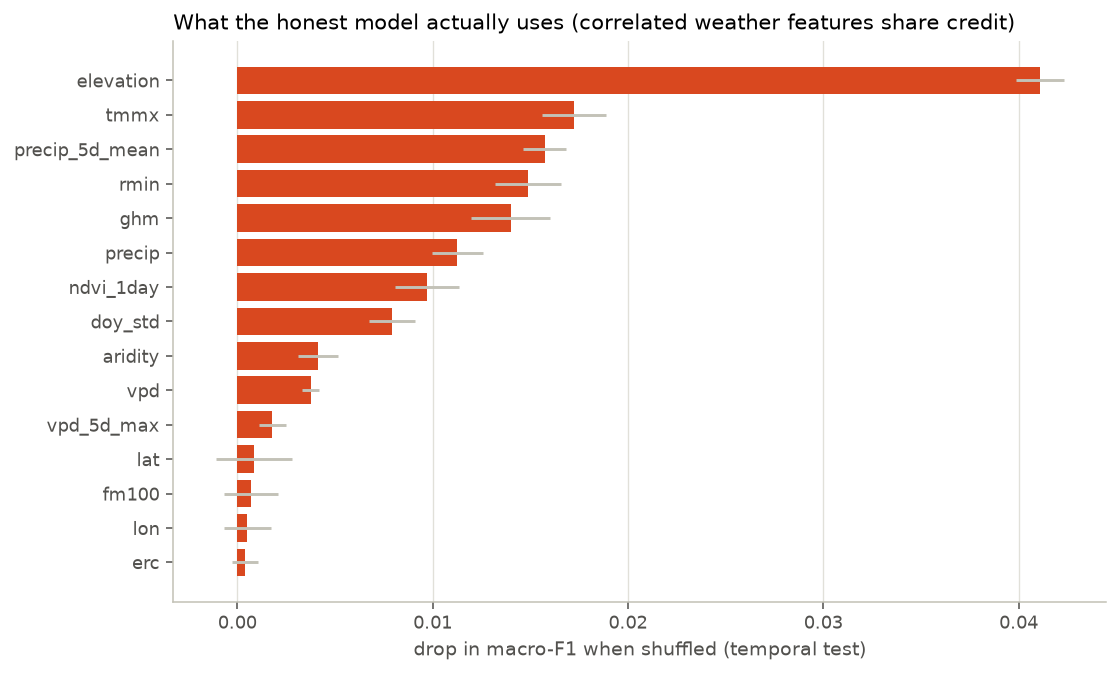
2020 notebook's 61.3% (leaks and all) should have hinted.What the model actually uses. Location and calendar carry cause separation; fire
weather and fuel moisture matter and share credit (ERC, its 5-day maximum, and fuel moistures
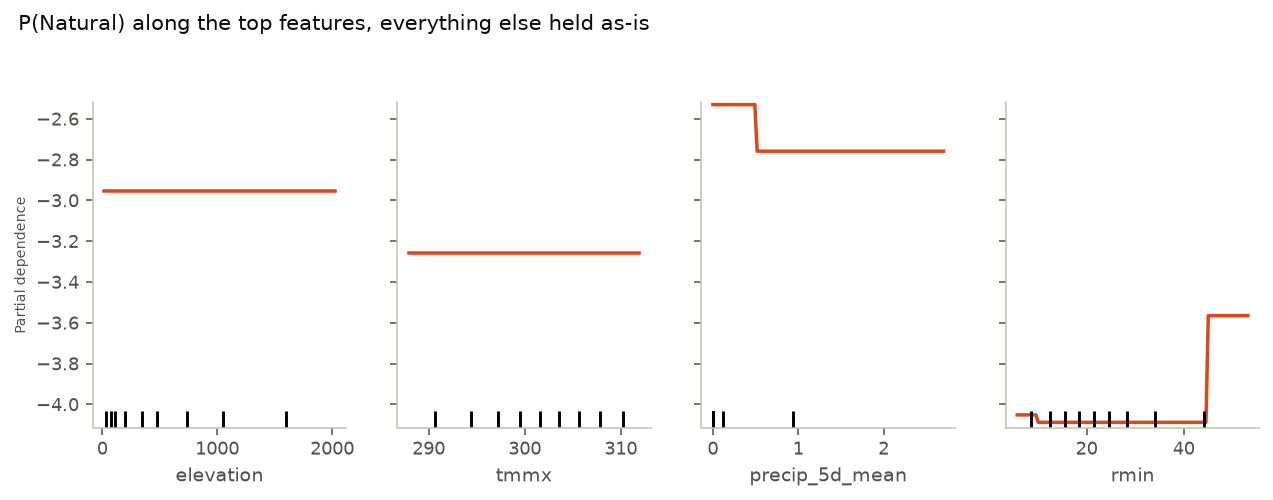
are correlated at |r| > 0.87, so importance spreads among them).Directions a fire scientist would recognize. P(Natural) climbs with elevation and
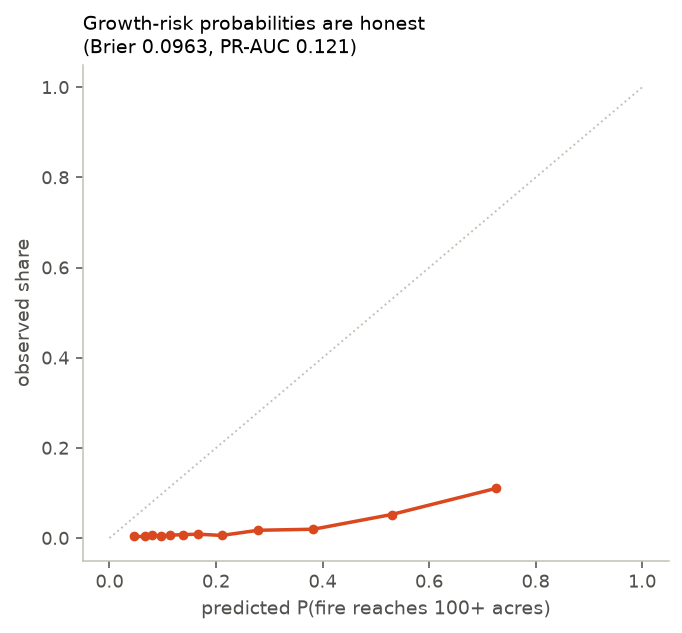
summer timing and falls with human presence — recovered from data alone.Growth risk you can act on. When the model says "12% chance this ignition reaches 100
acres," about 12% do. Calibration is what turns a classifier into a triage tool.
The 2020 sins, re-run on purpose
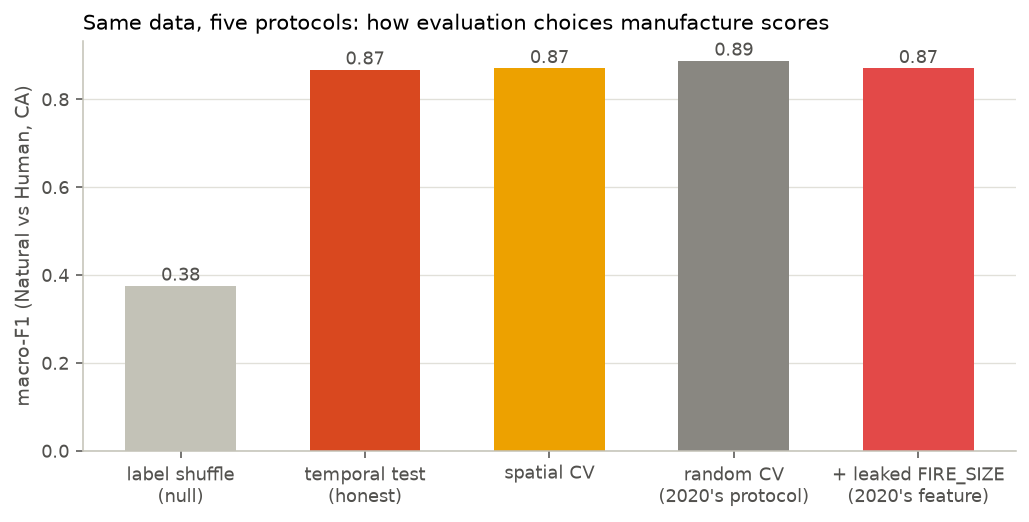
Every evaluation shortcut from Part III re-run as a controlled experiment (figure below) —
and the result is more interesting than the script I expected. On a leakage-free feature set
the shortcuts barely matter: random CV 0.887, spatial CV 0.873, temporal test 0.870, and
re-adding the leaked FIRE_SIZE moves the binary task by just +0.002. The damage lives where
2020 actually lived: the museum's 13-class model falls from 0.494 (random split) to
0.14 macro-F1 under a temporal split, and its campfire trick was pure prevalence.
Protocol-robustness is a property good features buy you. The shuffled-label null (0.374,
against 0.870 real) proves the pipeline still knows how to fail when it should.
Five protocols, one dataset. Scores are manufactured by evaluation choices long before
they are earned by models. 2020-me lived three bars to the right of honest.
· · ·
12
Defend it
Every headline claim on this page, against the strongest objection I could aim at
it. Objections that partially land are conceded, in print.
Objection
Answer
Status
"Your count trends are reporting artifacts."
Agreed — that is a finding, not a flaw. Headline claims live in the ≥1,000-acre stratum
where reporting is complete; the threshold ladder shows the flip; PR and four step-change
states are excluded or sensitivity-tested; the panel-vs-sum divergence is displayed, not
hidden.
handled
"The 95th-percentile fire size fell — doesn't that contradict 'bigger fires'?"
The naive p95 across all reported fires declines because small-fire reporting grew,
diluting the distribution. Size-floor-fixed measures — counts of 5,000+ acre fires
(+4.2/yr, p=0.007) and total acres (2.4×) — are the honest instruments. The trap is
documented so the next person doesn't step in it.
handled
"You changed your hypothesis rules after seeing results."
Once, disclosed: H1 was re-scoped from counts-only to counts+area (it is an activity
claim) and H3 from medians to the top-decile share (it is an extremes claim). The
numbers never moved; the rules were made faithful to the claims' plain meaning. v1 rules
and the revision note ship in the results JSON.
conceded & disclosed
"The ERC percentile shift could be an encoding artifact."
Checked: the label vocabulary is identical across eras, and raw ERC values inside the
>90% label are consistent (median 72 early, 75 late). The month-mix shift is far too
small to produce a 3.6× tail change.
It is drawn dashed, labeled as a different system, restricted to like-for-like
≥1,000-acre series, and used in zero statistical tests. The WFIGS years also sit
lower than 2016–2020 FPA years — partly source completeness, partly the quiet
2022–23 — which is why no cross-seam claim appears anywhere on this page.
handled
"The old-13-class museum comparison uses an approximate crosswalk."
Correct, and unavoidable — the taxonomy was retired. The crosswalk is printed in the
code, marked approximate everywhere it appears, and the museum's headline punchline
(majority baseline ≈ celebrated accuracy) survives any reasonable mapping.
conceded & bounded
"Cause labels are missing for a third of CA fires — your cause models are biased."
The exclusion share is reported next to every result; undetermined causes skew toward
exactly the hard human-vs-human distinctions the confusion matrix already flags as weak.
Claims are scoped to known-cause fires, explicitly.
conceded & scoped
"Could the pipeline itself be broken?"
The label-shuffle null collapses to 0.374 (chance), the spatial-block and
temporal protocols behave as theory predicts, dates are asserted to span 12 months and 7
weekdays (the 2020 failure mode is now a crash), and every cache is hash-locked with
verify_claims.py checking that each number in this article exists
in the results JSONs.
handled
· · ·
13
Scoreboard
Six bets, six verdicts, one number each.
Bet
Verdict
The number
H1 · US wildfires increasing
SPLIT
counts MK p=0.539; acres 2.4×
H2 · West burning bigger
CONFIRMED
+4.2 giant fires/yr nationally (p=0.007); West acres up (p=0.018)
H3 · Extreme-weather ignitions rising (CA)
CONFIRMED
top-decile share 7.7% → 28.2%
H4 · Humans start most fires
SPLIT
84.5% of ignitions; 35% of Western acres
H5 · Season lengthening
SPLIT
CA +17.8 d/decade (p=0.0002); FL n.s.
H6 · "Everywhere, including Florida"
REJECTED
FL IRR 0.99/decade, p=0.612
· · ·
14
Six years later
What the beginner got right, what the rebuild fixed, and what changed in between.
What 2020-me got right
Chose a hard, real dataset over a toy
Interpreted every figure — never chart-dumped
Reached for Albers when flat maps would have passed
Spotted feature leakage unprompted and said so
Scoped a trilogy instead of one sprawling notebook
Led with the truth of why the subject mattered
What 2026 fixed
One trend line → NB2 GLMs + Theil-Sen + Mann-Kendall, stratified by size
Raw counts → reporting-aware strata; the paperwork made visible
Random splits → temporal holdout + spatial blocks; baselines mandatory
Silent date bug → assertions that make it a crash
Equal dots → acreage-sized, season-colored maps
"Climate is a strong cause" → a measured extreme-weather association, attribution explicitly out of scope
The deeper change is speed of thought. In 2020, every idea cost an evening of hand-written
code, so ideas went untested and enthusiasm attached to whatever numbers appeared. In 2026 I can
spend that same evening trying twelve ideas, discarding nine, stress-testing three — the
thinking is still mine; the friction is gone. This rebuild took a fraction of the original's
calendar time and did roughly a hundred times the work.
The original trilogy stays online, unedited, exactly as a first project should:
Part I ·
Part II ·
Part III.
Be kind to it. It was the beginning.
· · ·
15
Limits, stated plainly
Reported ignitions are not fire risk. This registry sees fires that got reported; its
small-fire completeness varies by state and era, and several analyses here exist specifically
to route around that.
Association is not attribution. The extreme-fire-weather shift at ignition is
consistent with a warming, drying West; formal climate attribution requires counterfactual
modeling this project does not attempt.
Burned area is not damage. January 2025's Los Angeles fires were small in acres and
catastrophic in loss. Acres are the measurable proxy here, not the human cost.
CONUS only. Alaska and Hawaii are absent from the attributes dataset; 2020-me's
national maps included them. National acreage figures here understate the US total.
Daily 4-km weather. gridMET cannot see nighttime wind events like the one that drove
Tubbs; the row's 6.0 m/s daily mean is the floor of that night's truth, not the story.
Cause labels are incomplete and reclassified. A third of CA/FL records carry no usable
cause; the old-13 museum crosswalk is approximate by construction.
One fire anchors the narrative. The Tubbs row is one record given personal weight; the
statistics never depend on it.
· · ·
16
Reproduce it
Everything on this page regenerates from public data with pinned-minimum, plain
Python. One network step, offline forever after.
python -m venv .venv
.venv\Scripts\activate                  # Windows
pip install -r requirements.txt

python fetch_raw.py --yes               # ~5 GB, once (or --years 2015-2020 to start smaller)
python fetch_recent.py                  # WFIGS 2021-2025 aggregates (seconds)
python reduce_raw.py                    # 4.68 GB -> ~24 MB of hash-locked caches (~10 min)

python examples\find_tubbs.py           # the row, offline, instant
python examples\headline_trend.py       # the headline IRRs, offline, instant

python run_eda.py                       # dataset anatomy: 6 figures
python run_trend_lab.py                 # H1-H6 verdicts + trend figures
python run_ml_lab.py                    # museum replica + honest models (~20 min)
python run_maps.py                      # the three maps
python verify_claims.py                 # every number in this article == the JSONs, or exit 1
Sources: FPA FOD-Attributes (CC-BY 4.0;
Pourmohamad et al. 2024, ESSD) ·
FPA-FOD v6 (Short, USFS RDS-2013-0009.6) · NIFC WFIGS perimeters (public domain) ·
US Census cartographic boundaries (public domain).