DATA
SCIENTIST
Located in Orlando, Florida
Meet Aaron Long
Hello, my name is Aaron Long and welcome to my portfolio website. My portfolio contains data analytics projects that I 've worked on throughout the years. Some of my projects include data analysis, advance plotting on maps, and machine learning. I enjoy creating projects on topics that interest or are relevant to me, such as finance, healthcare, crypto.
I recently moved to Florida in October 2019, and am currently living in Orlando. I graduated in 2016 at University of California, Davis with a Bachelor's of Arts and Science in Economics and Statistics. I'm extremely interested and passionate about data science, ai, and the blockchain.
More personal details about me is that I have a cute dog named Clover and she is a four year old Papillon, who looks like a border collie puppy. Also I love trading cryptos, playing magic the gathering, and staying active with sports such as muay thai!
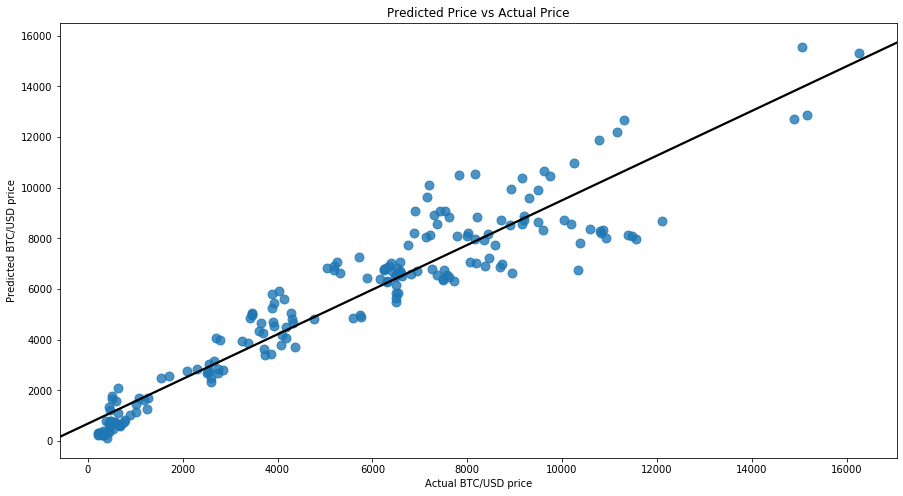
Bitcoin Regression
Date - February 28, 2021
Program(s) - Python
Libraries - numpy, pandas, sklearn, statsmodel
This project illustrates quantitative machine learning regression for bitcoin prices.
Stock Analysis with Highcharter
Date - February 17, 2020
Program(s) - R
Libraries - highcharter, quantmod, ttr
Highcharter is a R wrapper for Highcharts javascript library and its modules. Highcharts is a mature and flexible javascript charting library and it has a powerful API [http://www.highcharts.com/demo]. I wanted to demonstrate the power highcharter has with stocks and cryptocurrencies. Along with highcharter, I applied quantmod and TTR package to create powerful and interactive technical charts.
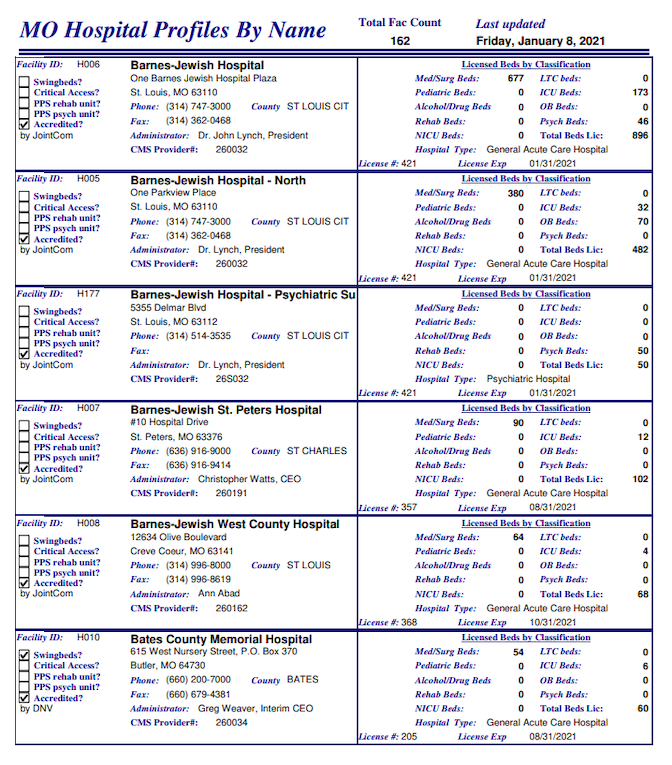
Parsing PDF's with Regular Expressions
Date - February 3, 2021
Program(s) - Python
Libraries - pandas, re, pdfplumber, requests, pyodbc
This project goes over parsing Pdfs with regular expressions, also know as regex. Data stored in pdfs can be difficult to import into a database, but since pdfs are actually text, regex patterns can be used to collect data. This project will go over using regex on a pdf to turn the pdf into a dataframe, and then insert it into a SQL server.
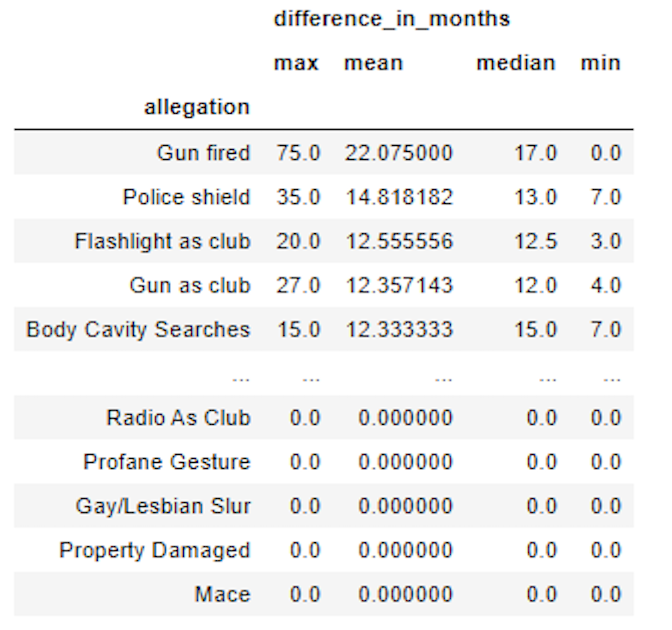
Blog Update and Python for Pivot Tables
Date - September 27, 2020
Program(s) - Python, Excel
Libraries - pandas, numpy, matplotlib
This projects demonstrates how to use Python for Microsoft Excel's pivot tables. It also contains an awesome blog update on my personal and professional life.
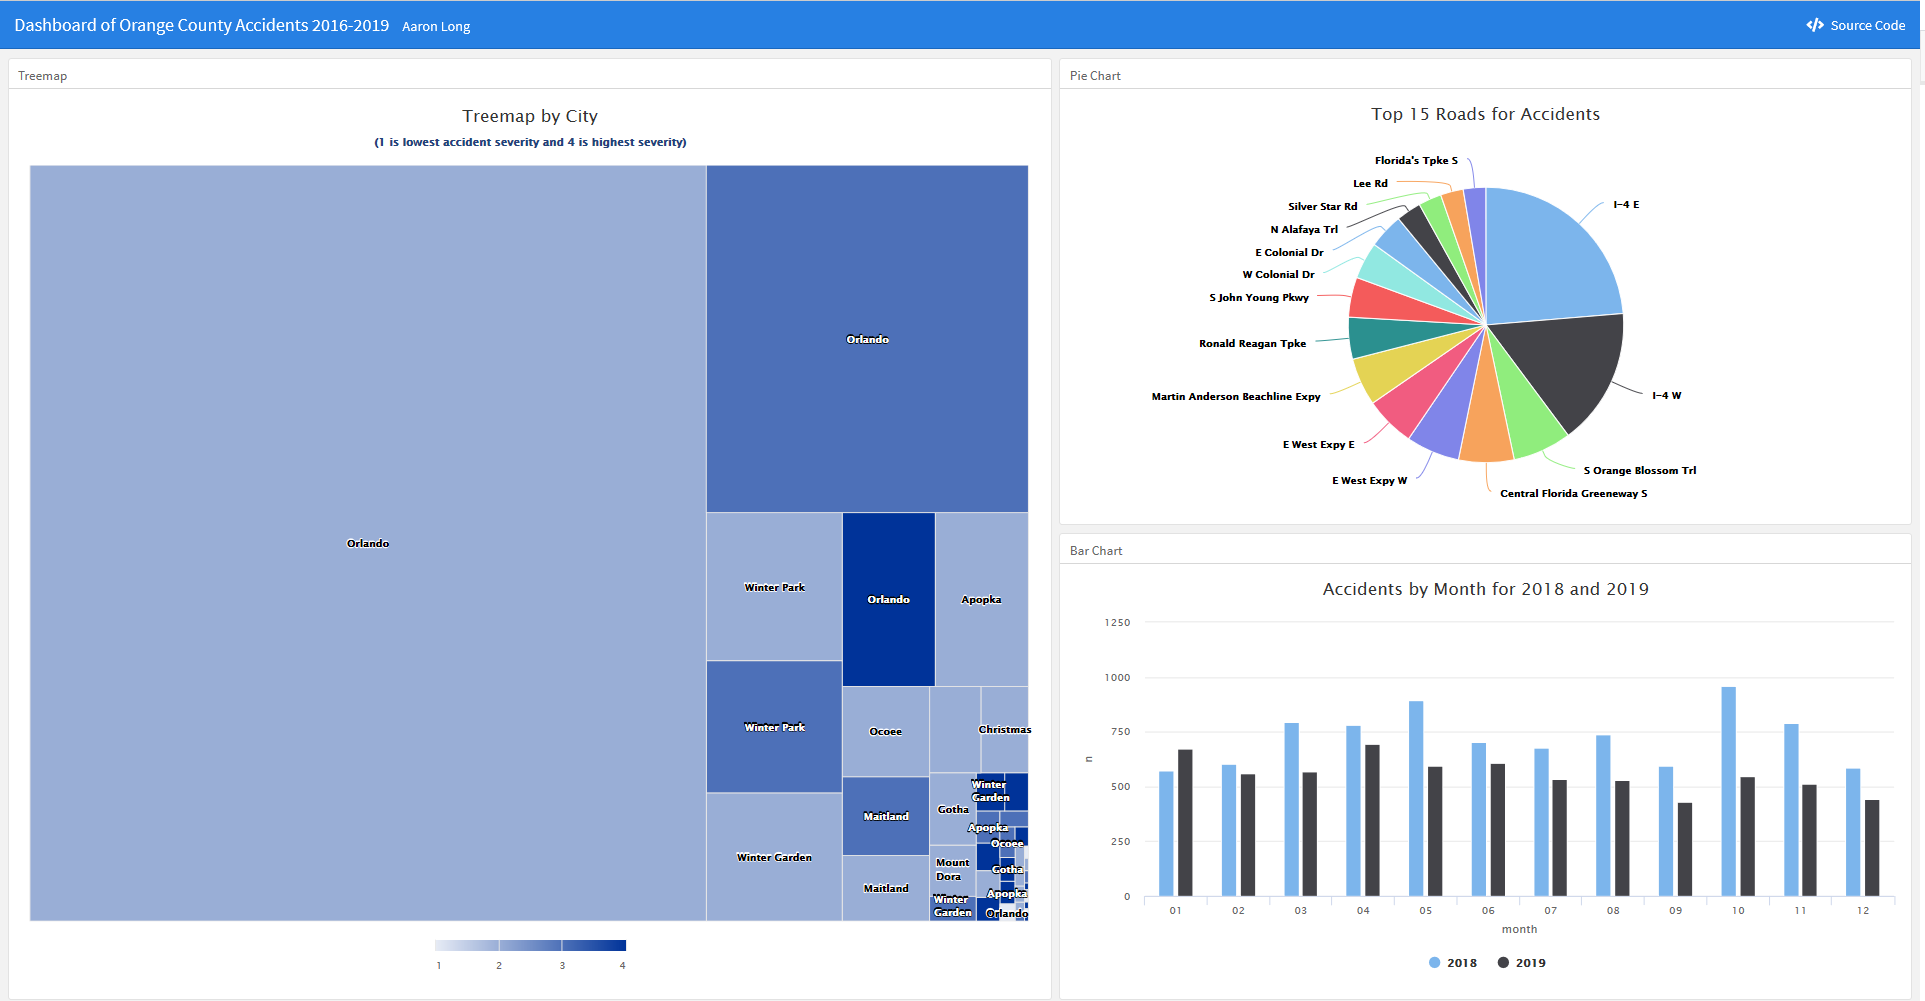
Flex Dashboard
Date - February 22, 2020
Program(s) - R
Libraries - flexdashboard, highcharter
This is an example of an interactive flex dashboard, which is a library in R. The data includes US Accidents between 2016 to 2019 with a focus on Orange County, Florida. The dashboard consists of three different graphs: tree map, pie chart, and bar chart. The charts are created with highcharter.
Machine Learning with Random Forest on Wildfire Data
Date - March 2, 2020
Program(s) - Python
Libraries - numpy, pandas, sqlite3, sklearn
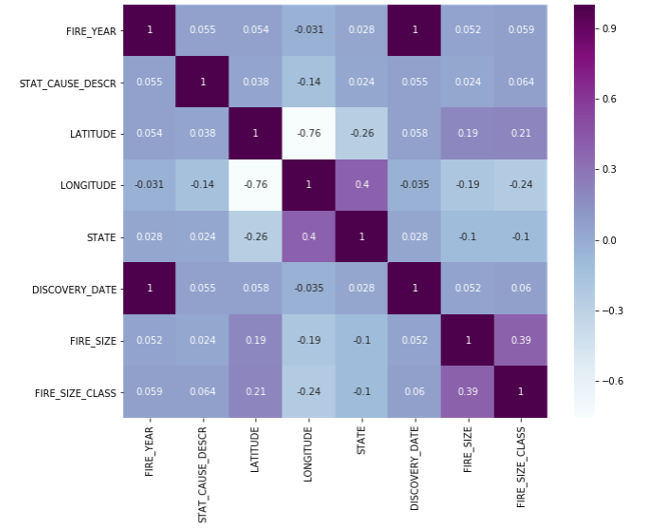
For this report, I will further my research on wildfire data that I explored with ggplot. This notebook will demonstrate using the machine learning tool called Random Forest.
Wildfire Analysis Part II
Date - February 5, 2020
Program(s) - R
Libraries - leaflet
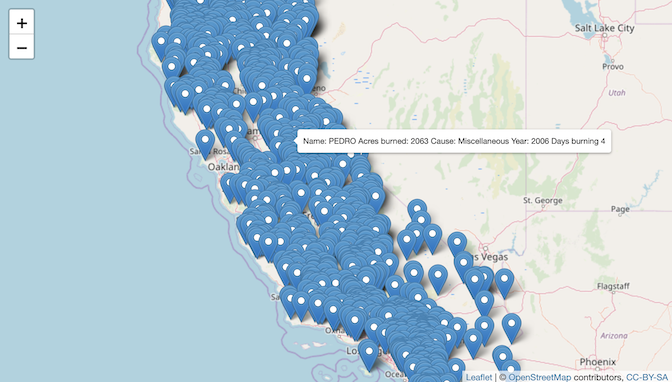
For the second part of the Wildfire Analysis report, I implemented leaflet maps. Leaflet provides an interactive google map that provides the name of the fire, acres burned, cause, years, and days burned. Feel free to explore each map by scrolling and hovering for more details and interesting information. I encourage you to look for your county or state and see if you can remember any of the fires that happened there.
Wildfire Analysis Part I
Date - February 5, 2020
Program(s) - R
Libraries - gglot, dbplyr, mapdata, ggthemes, maps
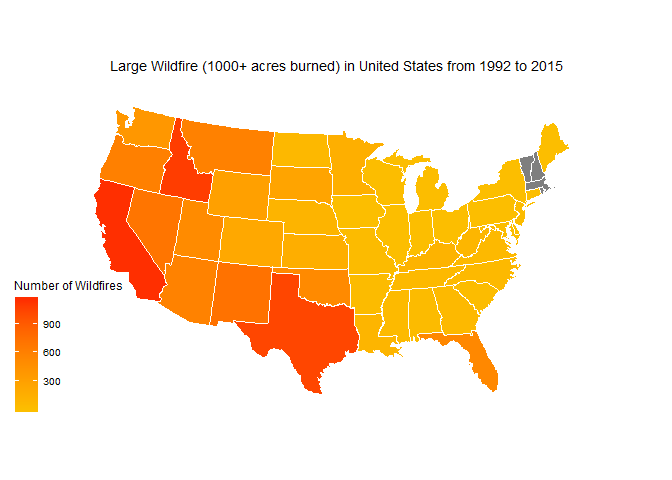
Back in 2017, the Tubbs Fire in Santa Rosa had not only destroyed my family’s home, but also completely destroyed our neighborhood. With losing 95% of our belongings including irreplaceable photographs and mementos, it was a truly devastating event that traumatized me and my family.
For this report, I am exploring a dataset on the 1.88 million wildfires that occurred in the US from 1992-2015.This dataset can be found in Kaggle: https://www.kaggle.com/rtatman/188-million-us-wildfires. I will briefly look at all the data then dive into large fires only. This means fires in class size F (1000-5000) acres burned and size G with is wildfires burning over 5000+ acres. Some of the largest fires in CA for example burned hundreds of thousands of acres. I want to focus on California and Florida as this is where I live now and where the data would be most relevant to me.
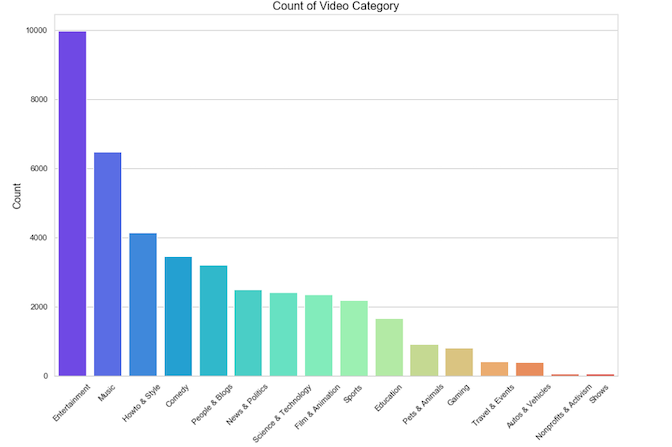
Exploratory Analysis on Trending Videos
Date - January 19, 2019
Program(s) - Python
Libraries - pandas, numpy, matplotlib, seaborn
As a new vlogger and content creator with my girlfriend on Youtube, I took upon interest on doing an exploratory data analysis (EDA) project on Youtube's Trending videos.